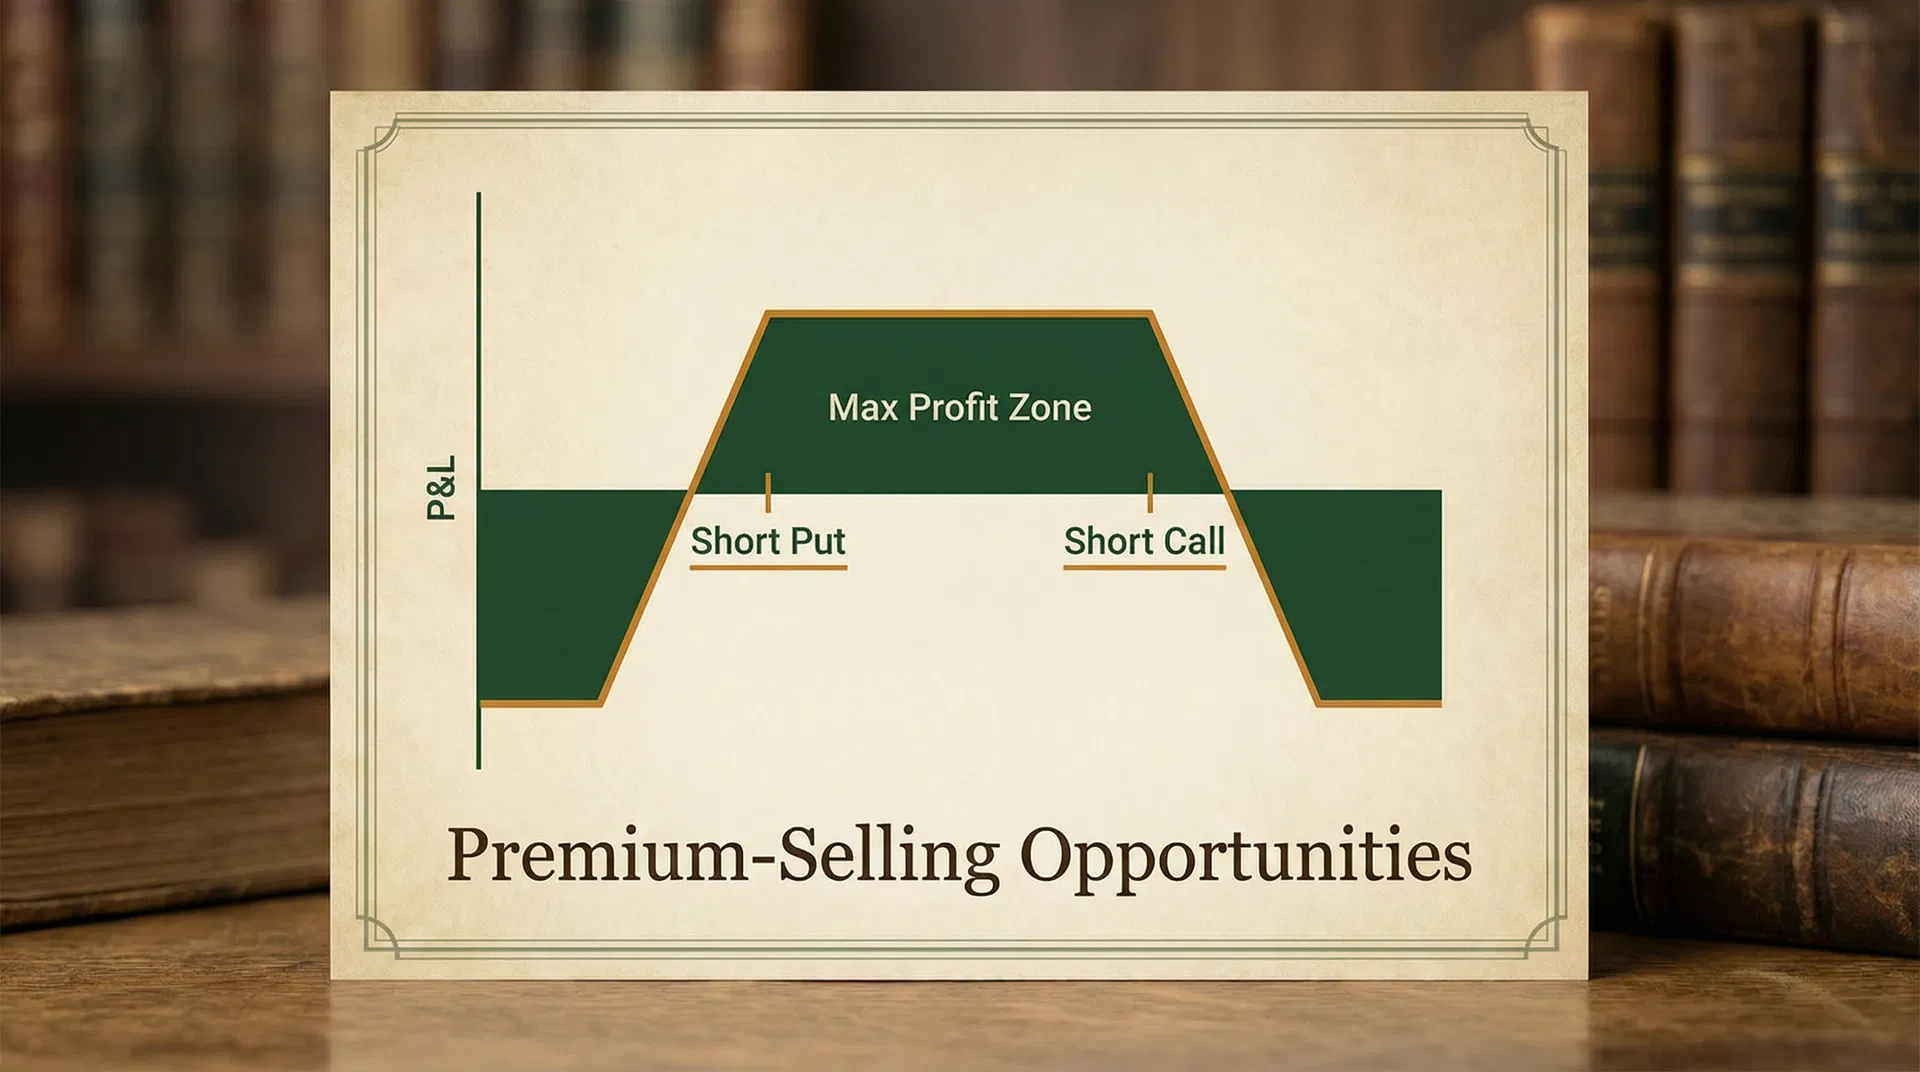
Premium-Selling Opportunities: A Comprehensive Framework for Identifying High-Probability Setups Across All Market Conditions
This report provides a comprehensive framework for identifying high-probability premium-selling opportunities. It integrates Implied Volatility Rank (IVR), earnings cycle analysis, sector rotation, and VIX regime assessment to uncover optimal iron condor and short strangle setups, leveraging the mean-reverting nature of implied volatility and time decay for consistent income generation.
Premium-Selling Opportunities: A Comprehensive Framework for Identifying High-Probability Setups
Executive Summary
This report outlines a robust framework for identifying high-probability premium-selling opportunities across diverse market conditions. By integrating Implied Volatility Rank (IVR), earnings cycle analysis, sector rotation, and VIX regime assessment, sophisticated options traders can systematically uncover optimal iron condor and short strangle setups. The core insight lies in exploiting the mean-reverting nature of implied volatility and the time decay of options, providing a structural edge for consistent income generation while meticulously managing risk.
The Anomaly Explained
The volatility anomaly refers to the empirical observation that implied volatility (IV) tends to be systematically higher than subsequent realized volatility (RV) [1]. This persistent overestimation of future price movements by the options market creates a structural edge for premium sellers. The anomaly exists due to several market microstructure factors: demand for hedging, behavioral biases, and the inherent uncertainty priced into options. Institutional investors often buy options for portfolio protection, driving up implied volatility. Furthermore, fear and uncertainty, especially during market downturns, can lead to exaggerated IV spikes, which typically revert to their mean over time. This mean-reverting characteristic of implied volatility is the cornerstone of premium-selling strategies, as options sold when IV is high tend to decay faster as IV normalizes, benefiting the seller [2].
Identifying the Setup
Identifying high-probability premium-selling setups requires a multi-faceted approach, combining quantitative metrics with contextual market analysis.
Implied Volatility Rank (IVR)
IV/HV Ratio — Mean Reversion Signal
Ratio above 1.3 = IV elevated vs. realized vol → premium-selling opportunity
Months above 1.3 (green line) represent optimal premium-selling windows. March and September show the highest IV/HV ratios in this example.
Implied Volatility Rank (IVR) is a crucial metric, indicating the current implied volatility relative to its 52-week range [3]. An IVR above 50% suggests that current IV is relatively high, making it an opportune time to sell premium. Ideally, traders look for IVR above 70% for maximum edge, as options are comparatively expensive, offering richer premiums. IV Percentile (IVP) is another related metric, indicating the percentage of days over the last 52 weeks that implied volatility traded below the current level. An IVP above 70% also signals elevated IV.
Delta Ranges
Delta vs. Probability of Profit vs. Premium
The core tradeoff: higher delta = more premium but lower probability of profit
- Premium ($)
- Prob. of Profit (%)
The 16Δ strike (1 standard deviation OTM) offers 84% probability of profit — the standard benchmark for systematic premium sellers.
For iron condors and short strangles, strike selection is paramount. The short strikes (the options sold) should typically be out-of-the-money (OTM), aiming for a high probability of expiring worthless. Common delta ranges for short strikes are between 10 and 20 delta for each leg, corresponding to approximately one standard deviation move. This provides a statistical buffer, ensuring a high probability (68-80%) that the underlying asset remains within the defined range until expiration. For iron condors, the long strikes (the options bought for protection) are typically chosen with a 5 delta, creating a defined risk profile.
Days to Expiration (DTE) Windows
The optimal Days to Expiration (DTE) window for premium selling strategies typically ranges from 30 to 60 days. This timeframe balances the rapid decay of theta (time decay) with sufficient time for the trade to play out and for adjustments if necessary. Options with shorter DTEs (e.g., 0-21 DTE) exhibit accelerated theta decay but also carry higher gamma risk, meaning price movements can have a more dramatic impact on the option's value. Longer DTEs (60+ days) offer slower theta decay but allow more time for adverse price movements to occur.
Earnings Cycles
Earnings announcements are significant volatility events. Implied volatility tends to spike significantly leading up to an earnings report and then experiences a sharp ** IV crush immediately after the announcement, regardless of the actual earnings results [4]. This phenomenon presents a prime opportunity for premium sellers. Strategies can be deployed before earnings to capture the elevated IV, with the expectation of profiting from the subsequent IV crush. However, this also carries significant event risk, as a large price move can quickly negate the benefits of IV crush. A more conservative approach involves selling premium after the earnings announcement, once the IV has normalized, focusing on the remaining time decay.
Sector Rotation
Sector rotation involves shifting investments among various sectors based on the different stages of the economic cycle [5]. Understanding sector rotation can help identify underlying assets with favorable conditions for premium selling. For instance, during periods of economic stability and growth, defensive sectors might exhibit lower implied volatility, making them less attractive for premium selling. Conversely, cyclical sectors might experience higher IV during periods of uncertainty or transition, offering better premium opportunities. By analyzing sector performance and economic indicators, traders can identify sectors that are likely to remain range-bound or experience predictable volatility patterns, thus providing higher-probability setups for iron condors and short strangles.
VIX Regime Analysis
VIX regime analysis involves understanding the current state of market volatility as indicated by the Cboe Volatility Index (VIX), often referred to as the fear gauge [6]. The VIX measures the market's expectation of 30-day volatility in the S&P 500. Different VIX levels can signal distinct market environments:
- Low VIX (e.g., below 15): Indicates market complacency and low expected volatility. While options premiums are generally lower, selling premium can still be profitable if IVR is high for specific underlying assets. This regime often favors iron condors due to expected range-bound trading.
- Medium VIX (e.g., 15-25): A more neutral environment. Opportunities can be found by focusing on individual stocks with elevated IVR due to company-specific events.
- High VIX (e.g., above 25): Signals market fear and high expected volatility. Options premiums are significantly inflated, offering the most attractive opportunities for premium selling. Short strangles and iron condors can be highly profitable in this regime, especially if volatility is expected to mean-revert downwards.
Understanding the current VIX regime helps in tailoring strategy selection and risk management. For instance, during high VIX periods, wider iron condors or strangles might be appropriate to capture the larger premiums, while during low VIX periods, tighter spreads or a focus on high IVR individual stocks might be more effective.
Trade Construction
This section details the construction of iron condors and short strangles, providing a concrete example for illustration.
Iron Condor Example
Iron Condor Payoff at Expiration
Short 50/45 put spread + Short 55/60 call spread | Net credit: $2.5
Max profit: $2.5/contract in the profit zone between $50–$55. Max loss: $2.50/contract outside the wings.
An iron condor is a neutral, defined-risk strategy that profits from an underlying asset remaining within a specified price range until expiration. It is constructed by simultaneously selling an out-of-the-money (OTM) bear call spread and an OTM bull put spread with the same expiration date. The long options define the maximum risk.
Example: Iron Condor on SPY (S&P 500 ETF)
- Underlying: SPY (trading at $450)
- Expiration: 45 Days to Expiration (DTE)
- IVR: 80% (indicating high implied volatility)
Trade Setup:
- Sell 1 SPY 460 Call (20 Delta): Receive $2.00 credit
- Buy 1 SPY 465 Call (10 Delta): Pay $0.75 debit
- Bear Call Spread Credit: $1.25 (2.00 - 0.75)
- Bear Call Spread Max Risk: $3.75 (465 - 460 - 1.25)
- Sell 1 SPY 440 Put (20 Delta): Receive $2.00 credit
- Buy 1 SPY 435 Put (10 Delta): Pay $0.75 debit
- Bull Put Spread Credit: $1.25 (2.00 - 0.75)
- Bull Put Spread Max Risk: $3.75 (440 - 435 - 1.25)
Combined Iron Condor Metrics:
- Total Credit Received: $2.50 ($1.25 + $1.25) per share, or $250 per contract
- Max Loss: $2.50 ($5.00 spread width - $2.50 credit) per share, or $250 per contract
- Breakeven Points:
- Upper: Call Strike + Total Credit = $460 + $2.50 = $462.50
- Lower: Put Strike - Total Credit = $440 - $2.50 = $437.50
- Probability of Profit (POP): Approximately 70-75% (based on 20 delta short strikes)
Short Strangle Example
Short Strangle Payoff at Expiration
Short 48 put + Short 57 call | Net credit: $3.5
A short strangle is a neutral, undefined-risk strategy (though often managed to be defined-risk in practice) that profits from an underlying asset remaining within a specified price range until expiration. It is constructed by simultaneously selling an OTM call and an OTM put with the same expiration date. Unlike an iron condor, it does not include long options for defined risk, making it suitable for experienced traders who actively manage positions.
Example: Short Strangle on QQQ (Nasdaq 100 ETF)
- Underlying: QQQ (trading at $380)
- Expiration: 45 Days to Expiration (DTE)
- IVR: 75% (indicating high implied volatility)
Trade Setup:
- Sell 1 QQQ 395 Call (15 Delta): Receive $3.00 credit
- Sell 1 QQQ 365 Put (15 Delta): Receive $3.00 credit
Combined Short Strangle Metrics:
- Total Credit Received: $6.00 ($3.00 + $3.00) per share, or $600 per contract
- Max Profit: $6.00 per share, or $600 per contract (if QQQ closes between $365 and $395 at expiration)
- Max Loss: Unlimited on the upside, substantial on the downside (theoretically unlimited, but practically managed)
- Breakeven Points:
- Upper: Call Strike + Total Credit = $395 + $6.00 = $401.00
- Lower: Put Strike - Total Credit = $365 - $6.00 = $359.00
- Probability of Profit (POP): Approximately 70% (based on 15 delta short strikes)
Entry/Exit Rules
Precise entry and exit rules are critical for consistent profitability and risk management in premium selling strategies.
Entry Conditions
- High IVR: Enter trades when the underlying asset's IVR is above 50%, ideally 70% or higher, to capitalize on inflated premiums and the mean-reverting nature of implied volatility.
- Optimal DTE: Target options with 30-60 DTE to maximize theta decay while allowing sufficient time for adjustments.
- Delta Selection: For iron condors, select short strikes with 10-20 delta. For short strangles, 15-20 delta is common. Long strikes for iron condors typically 5 delta.
- Market Conditions: Favor range-bound or slightly trending markets. Avoid entering before major, unpredictable news events unless specifically trading earnings volatility with a defined strategy.
- VIX Regime: High VIX environments offer the best premium, but require careful strike selection and position sizing. Low VIX environments necessitate a focus on high IVR individual stocks.
Profit Taking Rules
- 50% of Max Profit: A common and highly effective rule is to take profits when 50% of the maximum potential profit has been realized. This strategy, popularized by research from tastytrade, demonstrates that taking profits early significantly increases win rates and improves risk-adjusted returns by reducing exposure to gamma risk as expiration approaches [7].
- Time-Based Exit: If a trade has been open for a significant portion of its duration (e.g., 75% of DTE) and is still profitable, consider closing it to free up capital and reduce exposure, even if 50% profit target is not met.
Stop-Loss Rules
- 2x Credit Received: A robust stop-loss rule is to exit the trade if the loss reaches 2 times the credit received. For example, if an iron condor collects $2.50 in credit, close the trade if the loss reaches $5.00. This caps potential losses and prevents small losses from escalating into catastrophic ones.
- Breach of Short Strike: If the underlying asset price breaches one of the short strikes and shows momentum to continue, consider closing the affected spread or the entire position. This is particularly important for short strangles due to their undefined risk.
Rolling Adjustments
- When to Roll: If a short strike is challenged (i.e., the underlying price moves close to or past it) but the overall market outlook remains neutral, consider rolling the challenged side of the spread (or the entire position) out in time and/or away from the current price. This involves buying back the existing options and selling new ones with a later expiration date and/or different strikes, ideally for a credit.
- Purpose of Rolling: Rolling aims to collect additional premium, extend the time horizon for the trade to recover, and adjust the breakeven points. It is a defensive maneuver to manage losing positions and avoid assignment.
Risk Management
Effective risk management is paramount for long-term success in premium selling, given the potential for significant losses if trades go awry.
Position Sizing
- Small Position Size: Never allocate more than 1-5% of your total trading capital to any single trade. This ensures that no single losing trade can severely impact your portfolio. For iron condors, the max loss should be a small percentage of capital. For short strangles, due to undefined risk, position sizing should be even more conservative, or the strategy should be paired with active management and stop-losses.
- Defined Risk: Prioritize defined-risk strategies like iron condors, especially for newer traders or those with smaller accounts. If trading short strangles, always have a clear plan for managing potential breaches of the short strikes.
Correlation Risk
- Diversification: Avoid concentrating positions in highly correlated assets or sectors. If multiple trades are highly correlated, a single market event can adversely affect all of them simultaneously. Diversify across different sectors, industries, and even asset classes (e.g., indices, commodities, individual stocks).
- Beta-Weighting: For advanced traders, beta-weighting a portfolio to a broad market index (like SPY) can help understand and manage overall market exposure. Aim for a relatively neutral beta-weighted delta to avoid unintended directional bias.
Tail Risk Scenarios
- Black Swan Events: Premium selling strategies are inherently vulnerable to tail risk or
black swan events—unforeseen, high-impact events that can cause extreme market movements. While these are rare, their impact can be devastating for premium sellers. Strategies to mitigate tail risk include:
- Portfolio Hedging: Employing long volatility positions (e.g., long VIX calls, long out-of-the-money puts on broad market indices) as a small, ongoing hedge.
- Diversification: As mentioned, diversifying across uncorrelated assets reduces the impact of a single catastrophic event.
- Capital Allocation: Maintaining a significant portion of capital in cash or highly liquid assets to absorb potential losses and capitalize on opportunities during market dislocations.
What Can Go Wrong
- Unexpected Price Movements: A sudden, sharp move in the underlying asset beyond the breakeven points can lead to significant losses, especially for short strangles. This can be triggered by unexpected news, earnings surprises, or geopolitical events.
- Volatility Spike: While premium sellers benefit from decreasing volatility, a sudden and sustained increase in implied volatility (especially if the VIX spikes) can increase the value of the sold options, leading to unrealized or realized losses. This is particularly detrimental if the underlying asset also moves against the position.
- Assignment Risk: For short options, there is always the risk of early assignment, especially around ex-dividend dates for in-the-money options. While manageable, it can lead to unexpected stock positions and associated costs.
- Lack of Liquidity: Trading options on illiquid underlying assets can result in wide bid-ask spreads, making it difficult to enter or exit positions efficiently, potentially eroding profits or exacerbating losses.
Historical Context / Backtesting Evidence
Empirical evidence and backtesting studies consistently support the profitability of premium selling strategies, particularly when executed systematically and with robust risk management. The core principle—that implied volatility tends to overestimate realized volatility—has been a persistent feature of options markets.
Research by institutions like tastytrade has shown that selling options with high implied volatility (e.g., high IVR) and managing positions by taking profits at 50% of maximum gain significantly increases win rates and improves risk-adjusted returns [7]. For instance, studies on short strangles and iron condors often reveal win rates in the range of 65-80% when managed effectively. While individual trade profits may be smaller compared to directional strategies, the high probability of success leads to consistent income over time.
Indices like the Cboe S&P 500 Iron Condor Index (CNDR) aim to track the performance of hypothetical iron condor strategies. While the CNDR index itself has shown relatively flat performance over long periods, this often reflects a passive, unmanaged strategy. Active management, including dynamic strike selection based on IVR, timely profit-taking, and strategic adjustments, is crucial for outperformance [8].
Backtesting data often highlights:
- High Win Rates: Consistently above 60%, often reaching 70-80% for well-managed strategies.
- Positive Average Returns: While per-trade returns might be modest, the cumulative effect of high win rates leads to positive average returns over time.
- Improved Sharpe Ratios: Active management of premium selling strategies can lead to superior risk-adjusted returns compared to passive buy-and-hold strategies, as the consistent collection of premium reduces overall portfolio volatility.
ASCII/Text Diagram
Diagram 1: Iron Condor Payoff Profile
Profit
  ^
  |
  |      /\
  |     /  \
  |    /    \
  |   /      \
  |  /        \
  +-------------------> Price
  |  \        /
  |   \      /
  |    \    /
  |     \  /
  |      \/
  v
Loss

Strikes: P1 --- P2 --- S --- C1 --- C2
         (Long Put) (Short Put) (Underlying) (Short Call) (Long Call)
Diagram 2: Implied Volatility Mean Reversion
IV %
  ^
  |
  |    /\
  |   /  \
  |  /    \
  | /      \
  |/________\___________________
  |          Mean IV Level
  |\        /
  | \      /
  |  \    /
  |   \  /
  |    \/
  +-----------------------------> Time

(IV tends to revert to its historical mean over time)
Real Trade Example
Let's walk through a hypothetical iron condor trade on a technology ETF, XLK (Technology Select Sector SPDR Fund), from entry to exit.
Scenario: It's early January, and XLK has seen a significant run-up, but implied volatility has also risen, with its IVR at 85%. The VIX is elevated at 22. We expect XLK to consolidate or trade sideways in the coming weeks.
Entry (January 5th):
- Underlying: XLK (trading at $190)
- Expiration: February monthly expiration (45 DTE)
- Strategy: Iron Condor
Trade Details:
- Sell 1 XLK Feb 195 Call (20 Delta): Received $2.50
- Buy 1 XLK Feb 200 Call (10 Delta): Paid $0.80
- Net Call Spread Credit: $1.70
- Sell 1 XLK Feb 185 Put (20 Delta): Received $2.50
- Buy 1 XLK Feb 180 Put (10 Delta): Paid $0.80
- Net Put Spread Credit: $1.70
- Total Credit Received: $3.40 ($1.70 + $1.70) or $340 per contract
- Max Loss: $1.60 ($5.00 spread width - $3.40 credit) or $160 per contract
- Breakeven Points: Upper: $195 + $3.40 = $198.40; Lower: $185 - $3.40 = $181.60
- POP: ~70%
Mid-Trade (January 20th - 30 DTE remaining):
XLK has traded sideways, hovering around $191. Implied volatility has decreased, and the IVR has dropped to 40%. The iron condor is showing a profit.
- Current Value of Iron Condor: The combined value of the four legs is now $1.70. We initially received $3.40. The unrealized profit is $1.70.
- Profit Target Check: Our profit target is 50% of max profit, which is $3.40 / 2 = $1.70. We have reached our profit target.
Exit (January 20th):
- Buy to Close 1 XLK Feb 195 Call: Paid $0.90
- Sell to Close 1 XLK Feb 200 Call: Received $0.30
- Net Call Spread Debit: $0.60
- Buy to Close 1 XLK Feb 185 Put: Paid $0.90
- Sell to Close 1 XLK Feb 180 Put: Received $0.30
- Net Put Spread Debit: $0.60
- Total Debit Paid to Close: $1.20 ($0.60 + $0.60) or $120 per contract
- Net Profit: $3.40 (credit received) - $1.20 (debit paid) = $2.20 per share, or $220 per contract.
Analysis of Trade:
This trade demonstrates the effectiveness of premium selling when the underlying asset remains range-bound and implied volatility decreases. By taking profits at 50% of the maximum potential gain, the trader locked in a significant portion of the profit while reducing exposure to further market movements and gamma risk as expiration approached. The initial high IVR provided ample premium, and the subsequent IV contraction contributed to the rapid profitability.
Key Takeaways
- Prioritize High IVR: Always seek underlying assets with an Implied Volatility Rank (IVR) above 50%, ideally 70%+, to maximize the premium collected and exploit the mean-reverting nature of implied volatility.
- Optimal DTE Range: Focus on options with 30-60 Days to Expiration (DTE) to balance rapid theta decay with sufficient time for trade management and adjustments.
- Define Risk and Size Positions Conservatively: Utilize defined-risk strategies like iron condors or actively manage short strangles with strict stop-loss rules, allocating no more than 1-5% of capital per trade.
- Take Profits at 50%:** Systematically close winning trades when 50% of the maximum potential profit is achieved to enhance win rates and improve risk-adjusted returns.
- Integrate Multi-Factor Analysis: Combine IVR, earnings cycles, sector rotation, and VIX regime analysis to identify the highest-probability setups and adapt strategies to prevailing market conditions.
References
[1] Investopedia. How Implied Volatility (IV) Works With Options and Examples. https://www.investopedia.com/terms/i/iv.asp [2] tastytrade. Implied Volatility (IV) Rank & Percentile Explained. https://www.tastylive.com/concepts-strategies/implied-volatility-rank-percentile [3] tastytrade. Implied Volatility (IV) Rank & Percentile Explained. https://www.tastylive.com/concepts-strategies/implied-volatility-rank-percentile [4] menthorq. IV Crush: Understanding the Earnings-Driven Volatility Spike and How to Capitalize on It. https://menthorq.com/guide/iv-crush-understanding-the-earnings-driven-volatility-spike-and-how-to-capitalize-on-it/ [5] Fidelity. Sector Rotation Strategies. https://www.fidelity.com/learning-center/trading-investing/markets-sectors/intro-sector-rotation-strats [6] tastytrade. What is the VIX Volatility Index & How to Trade it?. https://tastytrade.com/learn/trading-products/options/what-is-vix-how-to-trade/ [7] optionalpha. Expected vs. Actual Win Rates When Selling Options. https://optionalpha.com/podcast/win-rates-when-selling-options [8] Reddit. Iron Condors: 17 Years of No Performance... and Counting. https://www.reddit.com/r/options/comments/1cx4pkt/iron_condors_17_years_of_no_performance_and/