How Market Makers Price Options: Understanding the Volatility Surface
How Market Makers Price Options: Understanding the Volatility Surface How Market Makers Price Options: Understanding the Volatility Surface In the intricate world of options trading, understanding how prices are determined is not just academic; it's a critical edge. Many retail t
Abstract
How Market Makers Price Options: Understanding the Volatility Surface How Market Makers Price Options: Understanding the Volatility Surface In the intricate world of options trading, understanding how prices are determined is not just academic; it's a critical edge. Many retail t
How Market Makers Price Options: Understanding the Volatility Surface
In the intricate world of options trading, understanding how prices are determined is not just academic; it's a critical edge. Many retail traders view options prices as a black box, driven solely by underlying asset movement and time decay. While these are undoubtedly factors, the true architect behind options premiums is the market maker, and their primary tool for pricing is the volatility surface options. This sophisticated, multi-dimensional construct dictates the implied volatility (IV) for every strike and expiration, revealing the market's collective expectation of future price swings.
At Volatility Anomaly, we constantly emphasize the importance of volatility analysis. It's the lifeblood of options trading, particularly for strategies like the iron condor, which thrive on selling overpriced premium. A deep dive into the volatility surface isn't just about satisfying intellectual curiosity; it's about equipping you with the knowledge to identify mispricings, optimize your strike selection, and ultimately, enhance your profitability. By grasping how market makers use this surface to quote prices, you can anticipate their moves, understand why certain strikes are priced the way they are, and gain a significant advantage in constructing robust, high-probability trades. This article will demystify the volatility surface, show you how market makers leverage it, and—crucially—demonstrate how this advanced understanding can revolutionize your iron condor trading strategy.
Background & Context: The Market Maker's Imperative
To truly appreciate the volatility surface, we must first understand the role and motivations of a market maker. A market maker's primary function is to provide liquidity by continuously quoting both bid and ask prices for options contracts. They profit from the bid-ask spread and by managing their inventory risk. Unlike retail traders who often take directional bets, market makers aim for delta neutrality, hedging their positions to minimize exposure to underlying price movements. Their profit comes from the statistical edge of selling options at a slightly higher price than they buy them, and from the decay of options premium.
However, quoting thousands of options contracts across multiple expirations and strikes for hundreds of underlying assets is an enormous computational challenge. They can't simply use a single implied volatility for all options on a given stock. Why? Because the market doesn't perceive all options as having the same risk or probability of being in-the-money. Out-of-the-money (OTM) puts, for instance, often command higher implied volatility than OTM calls due to "fear" of downside moves (the "skew"). Similarly, longer-dated options might have different IVs than short-dated ones.
This is where the options pricing model, specifically the Black-Scholes-Merton model or its more sophisticated variants, comes into play. While the Black-Scholes model assumes a constant volatility, market makers observe that implied volatility is anything but constant. It varies by strike price (creating the "skew" or "smile") and by time to expiration (creating the "term structure"). The volatility surface is essentially a three-dimensional plot that captures these variations, allowing market makers to accurately price options and manage their risk across the entire options chain. Without such a model, their risk would be unmanageable, and liquidity would evaporate.
Consider the current market environment. With the VIX hovering around 12-15, indicating relatively low volatility, and major indices like the S&P 500 (SPX) near all-time highs, many traders are looking to sell premium. For example, on a day where SPY is trading at $520, the implied volatility for a 30-day 5% OTM put might be 18%, while a 30-day 5% OTM call might be 15%. This difference is the market's perception of risk, and it's precisely what the volatility surface maps out. Understanding this map is crucial for anyone looking to sell premium effectively, especially with strategies like the iron condor.
Core Concept Deep Dive: The Volatility Surface Explained
The volatility surface is a three-dimensional representation where:
- X-axis: Strike Price (or moneyness, often expressed as delta or percentage OTM/ITM)
- Y-axis: Time to Expiration
- Z-axis: Implied Volatility (IV)
Imagine a topographical map where the contours represent different levels of implied volatility. Instead of elevation, you have IV.
1. The Volatility Skew (by Strike)
This is the most commonly discussed feature. The Black-Scholes model assumes a constant IV across all strikes for a given expiration. In reality, this is rarely true.
- Equity Index Skew (e.g., SPY, QQQ): For broad market indices, OTM puts typically have higher IVs than OTM calls. This is often called the "volatility smirk" or "skew." Investors are more willing to pay for protection against downside moves (puts) than for speculative upside (calls), especially after events like the 1987 crash.
- Example: If SPY is at $520, a 30-day 0.20 delta put (e.g., strike $500) might have an IV of 17%, while a 30-day 0.20 delta call (e.g., strike $540) might have an IV of 14%. The put side is "more expensive" in terms of IV.
- Individual Stock Skew (e.g., AAPL, TSLA): For individual stocks, the skew can vary. Growth stocks or those with high short interest might exhibit a "reverse skew" where OTM calls have higher IVs than OTM puts, reflecting demand for upside speculation. However, for most mature stocks, a similar but less pronounced put skew often exists.
- Example: For AAPL trading at $170, a 45-day 0.15 delta put (e.g., strike $155) might have an IV of 25%, while a 45-day 0.15 delta call (e.g., strike $185) might have an IV of 23%.
- Volatility Smile: Less common now, but historically, both OTM and ITM options had higher IVs than ATM options, forming a "smile" shape. This often appears in currency options.
2. The Volatility Term Structure (by Expiration)
This refers to how implied volatility changes across different expiration dates for a given strike (or moneyness, typically ATM).
- Contango: The most common state, where longer-dated options have higher IVs than shorter-dated options. This reflects the market's expectation that uncertainty increases over longer time horizons.
- Example: For SPY, a 30-day ATM option might have an IV of 13%, while a 90-day ATM option might have an IV of 15%.
- Backwardation: A less common but significant state where shorter-dated options have higher IVs than longer-dated options. This typically occurs during periods of high market stress or anticipated near-term events (e.g., earnings, FOMC meetings), signaling immediate uncertainty.
- Example: Ahead of a major earnings announcement for NVDA, 7-day ATM options might have an IV of 60%, while 60-day ATM options might have an IV of 45%.
3. The Volatility Surface in Practice for Market Makers
Market makers continuously monitor and adjust their internal volatility surface. When they receive an order to buy or sell an option, they don't just pull a single IV number. They consult their surface, find the IV corresponding to that specific strike and expiration, plug it into their options pricing model, and then add their bid-ask spread.
Their goal is to keep their delta, gamma, vega, and theta exposures within acceptable limits. If they sell a lot of OTM puts, their surface might subtly adjust, reflecting a slight increase in IV for those strikes to encourage buyers and balance their book. This dynamic adjustment is what makes the market so efficient, albeit complex.
Understanding this dynamic is crucial for retail traders. When you see an option with an unusually high or low IV compared to its neighbors on the surface, it could be an anomaly, a mispricing, or simply a reflection of market maker hedging activity around a specific strike. For iron condor traders, identifying areas where IV is "rich" (i.e., higher than historical or comparable options) is key to selling premium effectively.
Practical Application: Optimizing Iron Condors with Volatility Surface Insights
Now, let's translate this theoretical understanding into actionable strategies for iron condor traders. An iron condor involves selling an OTM call spread and an OTM put spread, aiming to profit from the underlying staying within a defined range and from time decay. The goal is to sell options with high implied volatility and buy options with lower implied volatility to define risk.
Step 1: Assess Overall Volatility & IV Rank
Before even looking at the surface, gauge the overall volatility environment. We often use tools like the VIX for the broader market or IV Rank/IV Percentile for individual stocks.
- High IV Rank (e.g., > 50%): Generally favorable for selling premium. The overall "height" of the volatility surface is elevated.
- Low IV Rank (e.g., < 20%): Less favorable for selling premium. The surface is "flat" or depressed, meaning less premium to collect.
Example: If SPY's IV Rank is 70% and the VIX is at 25, the market is pricing in significant movement. This suggests that options across the surface are generally more expensive, offering better premium collection opportunities for iron condors. If SPY's IV Rank is 15% and the VIX is at 12, options are cheap, making premium selling less attractive.
Step 2: Identify the Optimal Expiration (Term Structure)
Examine the volatility term structure.
- Contango: Shorter-dated options often have lower IVs but faster time decay (theta). Longer-dated options have higher IVs but slower decay. For iron condors, we typically favor shorter-to-medium term expirations (30-60 days to expiration) to capitalize on accelerated theta decay. While their IVs might be lower than longer-dated options, the rate of decay is often more advantageous.
- Backwardation: If short-term IVs are significantly elevated due to an impending event, this can be an excellent time to sell those specific short-dated options, as their IV is likely to crash post-event. However, this also implies higher risk of a large move.
Actionable Tip: Use a tool like the Volatility Anomaly screener to filter for tickers with high IV Rank and expirations within the 30-60 DTE range.
Step 3: Pinpoint Strike Selection Using the Volatility Skew
This is where the volatility skew becomes critical for iron condors. You want to sell options where IV is relatively high and buy options where IV is relatively low.
- Selling the "Smirk" (Puts): For index products like SPY or QQQ, OTM puts often have significantly higher IVs than OTM calls at equivalent deltas. This means you can collect more premium for selling OTM puts.
- Strategy: Consider constructing an iron condor with a slightly wider put spread (more strikes between sold and bought put) or selling a put spread at a slightly higher delta (e.g., 0.15-0.20 delta for the short put) compared to the call side (e.g., 0.10-0.15 delta for the short call). This leverages the higher IV on the put side.
- Identifying "Sweet Spots": Sometimes, specific strikes might show an IV anomaly—a spike or dip—due to market maker hedging or large institutional orders. While hard to spot without advanced tools, understanding the general shape of the skew helps you avoid selling options that are "cheap" in terms of IV.
- Delta as a Proxy for Moneyness: Instead of fixed percentages OTM, use delta. For iron condors, we typically aim for short options with 0.10-0.25 delta, providing a high probability of expiring OTM.
Worked Example: SPY Iron Condor
Let's consider SPY trading at $520. The VIX is at 14, and SPY's IV Rank is 30% (moderate). We're looking at options with 45 days to expiration (DTE).
Observed Volatility Surface Data (Hypothetical for 45 DTE):
- Puts:
- Strike $505 (0.15 Delta): IV = 16.5%
- Strike $500 (0.10 Delta): IV = 15.8%
- Strike $495 (0.07 Delta): IV = 15.0%
- Calls:
- Strike $535 (0.15 Delta): IV = 14.0%
- Strike $540 (0.10 Delta): IV = 13.5%
- Strike $545 (0.07 Delta): IV = 13.0%
Notice the clear put skew: puts have higher IVs than calls at comparable deltas.
Entry Strategy:
Given the put skew, we might lean slightly more aggressively on the put side (higher delta for short put) or choose a wider put spread to maximize premium capture while maintaining a balanced risk profile.
Iron Condor Construction:
- Sell Put Spread:
- Sell 1 SPY $505 Put (0.15 Delta) for $2.10 (IV 16.5%)
- Buy 1 SPY $500 Put (0.10 Delta) for $1.70 (IV 15.8%)
- Credit Received: $0.40
- Max Risk: $5.00 (width) - $0.40 (credit) = $4.60
- Sell Call Spread:
- Sell 1 SPY $535 Call (0.15 Delta) for $1.80 (IV 14.0%)
- Buy 1 SPY $540 Call (0.10 Delta) for $1.50 (IV 13.5%)
- Credit Received: $0.30
- Max Risk: $5.00 (width) - $0.30 (credit) = $4.70
Total Iron Condor:
- Total Credit Received: $0.40 + $0.30 = $0.70 ($70 per condor)
- Max Risk: $5.00 (since both spreads are $5 wide, max risk is on one side) - $0.70 (credit) = $4.30 ($430 per condor)
- Breakeven Points: $520 (current price) - $7.00 (credit) = $513 (lower breakeven); $520 (current price) + $7.00 (credit) = $527 (upper breakeven). More accurately, short put strike - credit = $505 - $0.70 = $504.30; short call strike + credit = $535 + $0.70 = $535.70.
- Probability of Profit (POP): Approximately 70-75% (based on 0.15 delta short strikes).
Management & Exit:
We typically aim to close iron condors for 50-75% of the max profit. If the trade moves against us, we might adjust or close.
- Scenario 1 (Profit): SPY stays between $505 and $535. After 20 days, the condor is trading for $0.25 (70% profit). We close it.
- Scenario 2 (Adjustment): SPY drops to $510, nearing our put spread. The short $505 put delta has increased to -0.30. We might roll the entire condor down, or just the call spread down, to collect more credit and widen the profit range. Or, if the put spread is severely challenged, we might close it and manage the call spread separately.
- Scenario 3 (Loss): SPY drops below $500. We close the entire condor to cap losses at the max risk of $4.30. Our position monitoring tools at Volatility Anomaly would alert us to delta exceeding a threshold (e.g., -0.30 or -0.40) or a specific percentage loss.
By understanding the volatility surface, we consciously chose to sell the $505 put with a higher IV (16.5%) compared to the $535 call (14.0%), maximizing premium capture on the side where the market expects more movement. This granular analysis of IVs across strikes and expirations is a hallmark of advanced market maker options pricing and should be integrated into your iron condor strategy.
Risk Management: Navigating the Volatility Terrain
While understanding the volatility surface provides a powerful edge, it doesn't eliminate risk. In fact, misinterpreting or ignoring changes in the surface can lead to significant losses.
1. Volatility Spikes and Surface Shifts
The volatility surface is not static. It constantly shifts in response to market news, economic data, and overall sentiment.
- Sudden IV Spikes: An unexpected event (e.g., geopolitical crisis, company scandal) can cause IVs across the entire surface to jump, especially in shorter-dated options and OTM puts. For a seller of iron condors, this means your short options suddenly become more expensive, increasing the mark-to-market loss.
- Mitigation: Keep position sizes small relative to your account. Use stop-loss orders or pre-defined exit criteria (e.g., close if the condor value doubles). Consider buying back challenged spreads quickly.
- Skew Changes: The shape of the skew can change. For example, a stock known for high growth might suddenly develop a strong put skew if negative news emerges, making OTM puts much more expensive.
2. Gamma Risk and Pin Risk
As expiration approaches, gamma (the rate of change of delta) increases dramatically, especially for ATM options.
- Pin Risk: If the underlying asset closes exactly at one of your short strikes at expiration, you could be assigned on one leg and not the other, leading to a directional position overnight.
- Mitigation: Close iron condors well before expiration (e.g., 5-7 DTE). If you must hold through expiration, actively manage positions that are near your short strikes.
3. Liquidity and Bid-Ask Spreads
While market makers provide liquidity, not all options are equally liquid. OTM options, especially those far from the money or with unusual expirations, can have wide bid-ask spreads.
- Impact: Wide spreads erode your potential profit when entering and exiting. The price you see on your platform might not be the price you get.
- Mitigation: Stick to highly liquid underlying assets (SPY, QQQ, AAPL, MSFT, GOOGL, AMZN, TSLA). Use limit orders for entry and exit, placing them within the bid-ask spread to get a better fill.
4. Position Sizing and Diversification
The single most important risk management tool.
- Position Sizing: Never allocate more than 1-2% of your total trading capital to any single trade's max loss. For an iron condor with a $430 max loss, this means a minimum account size of $21,500-$43,000.
- Diversification: Don't put all your eggs in one basket. Spread your capital across different underlying assets, sectors, and even different strategies. Avoid having too many positions highly correlated to each other (e.g., multiple iron condors on tech stocks).
"Risk comes from not knowing what you're doing." - Warren Buffett. Understanding the volatility surface is a crucial step in "knowing what you're doing" in options trading.
Advanced Considerations: Beyond the Basics
For experienced traders, the volatility surface offers even deeper insights and opportunities.
1. Volatility of Volatility (VVOL)
Just as an underlying asset has volatility, implied volatility itself has volatility. This "vol of vol" is captured by options on VIX (VIX options) or by looking at how rapidly the surface changes. High VVOL means the surface is likely to shift dramatically, increasing risk for premium sellers but offering opportunities for volatility traders.
- Application: If VIX options are expensive (high IV on VIX options), it suggests the market expects VIX itself to move significantly. This can be a warning sign for iron condor sellers, as a VIX spike would lift the entire volatility surface, making your short options more expensive.
2. Dynamic Hedging and Gamma/Vega Trading
Market makers are constantly dynamically hedging their positions. As the underlying moves, their delta changes, requiring them to buy or sell the underlying asset. This activity itself can influence prices.
- Gamma Scalping: Market makers profit from gamma. If they are short gamma (as iron condor sellers often are), they buy low and sell high the underlying asset as it moves back and forth.
- Vega Trading: Advanced traders might take positions specifically to profit from changes in the volatility surface (vega). For example, buying long-dated options when IV is historically low, anticipating a rise in the term structure.
3. Volatility Arbitrage
Sophisticated firms actively look for arbitrage opportunities within the volatility surface. This involves identifying situations where an option is mispriced relative to its neighbors on the surface, or relative to a theoretical model.
- Example: If a 30-day $100 strike option has an IV of 20%, but the 29-day $100 strike has an IV of 25% (and no event is pending), there might be a short-term mispricing in the term structure. These opportunities are usually fleeting and require high-frequency trading.
4. Using the Volatility Anomaly System for Surface Insights
While we don't provide a direct 3D visualization of the volatility surface, our platform's focus on IV Rank, IV Percentile, and our automated screener implicitly leverages these concepts.
- Automated Screener: Filters for high IV Rank, allowing you to identify underlying assets where the entire volatility surface is elevated, providing richer premium.
- Weekly Picks: Our curated weekly picks often consider the current term structure and skew for optimal strike selection, aiming for the "sweet spots" on the surface.
- Position Monitoring: Alerts for delta, theta, and overall P&L help you manage your positions as the volatility surface shifts, ensuring you react appropriately to changes in implied volatility.
By combining our tools with your understanding of the volatility surface, you can move beyond simple directional bets and engage in more nuanced, probability-driven options trading.
Conclusion & Key Takeaways
The volatility surface is not merely a theoretical construct; it is the fundamental framework market makers use to price options and manage their risk. For retail options traders, particularly those employing strategies like the iron condor, understanding this surface is paramount. It allows you to move beyond simply looking at the underlying price and delve into the true drivers of option premium: implied volatility across different strikes and expirations.
By analyzing the volatility skew, you can identify where the market is pricing in higher risk (e.g., OTM puts on indices) and strategically sell premium in those areas. By understanding the term structure, you can select the optimal expiration to capitalize on time decay or exploit temporary backwardation. Integrating these insights into your trading process, alongside robust risk management and tools like the Volatility Anomaly screener, transforms options trading from a speculative gamble into a calculated, probability-driven endeavor. Embrace the volatility surface, and you will unlock a deeper, more profitable dimension of options trading.
Key Takeaways for Iron Condor Traders:
- The Volatility Surface is Key: It's a 3D map showing implied volatility (IV) across different strikes and expirations, dictating how market makers price options.
- Leverage the Volatility Skew: For index iron condors (e.g., SPY, QQQ), OTM puts often have higher IVs than OTM calls. Strategically sell put spreads at slightly higher deltas (e.g., 0.15-0.20) or wider widths to capitalize on this richer premium.
- Understand the Term Structure: Favor shorter-to-medium term expirations (30-60 DTE) in contango markets for optimal theta decay. Be aware of backwardation for event-driven opportunities/risks.
- Use Delta for Strike Selection: Aim for short options with 0.10-0.25 delta for high probability of profit, adjusting based on the observed IV skew.
- Prioritize High IV Rank: The overall "height" of the volatility surface (reflected in IV Rank/Percentile) indicates how much premium is available. High IV Rank (>50%) generally favors selling premium.
- Implement Robust Risk Management: Position size conservatively (1-2% max loss per trade), diversify, and close iron condors before expiration to avoid gamma and pin risk. Monitor for sudden IV spikes.
- Utilize Advanced Tools: Platforms like Volatility Anomaly help identify high IV opportunities and monitor positions, implicitly guiding you through the volatility surface landscape.
#VolatilityAnomaly · #IVRank · #OptionsTrading · #VRP
You Might Also Like
Volatility Anomaly
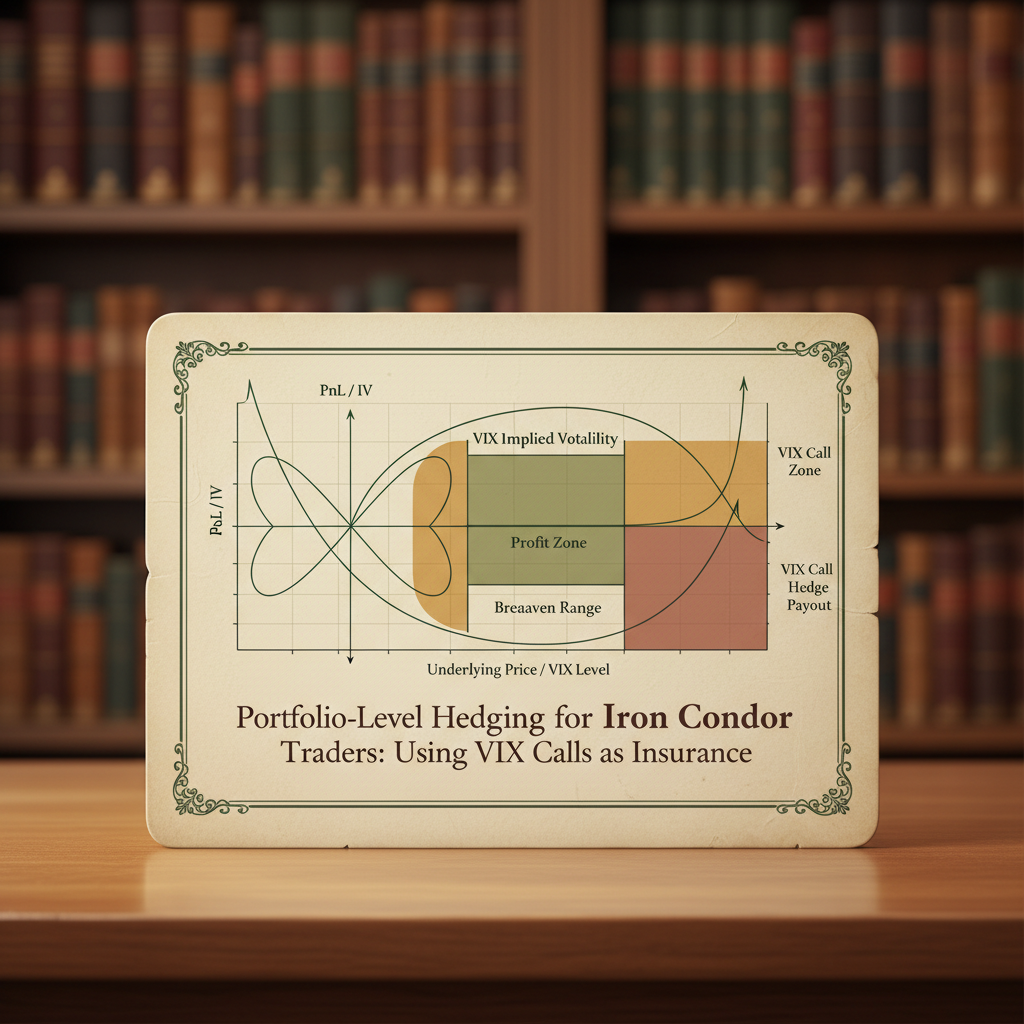
Portfolio-Level Hedging for Iron Condor Traders: Using VIX Calls as Insurance
Portfolio-Level Hedging for Iron Condor Traders: Using VIX Calls as Insurance Portfolio-Level Hedging for Iron Condor Traders: Using VIX Calls as Insurance In the world of options trading, strategies like the Iron Condor are highly popular for their ability to generate consistent
Jan 1970
Volatility Anomaly
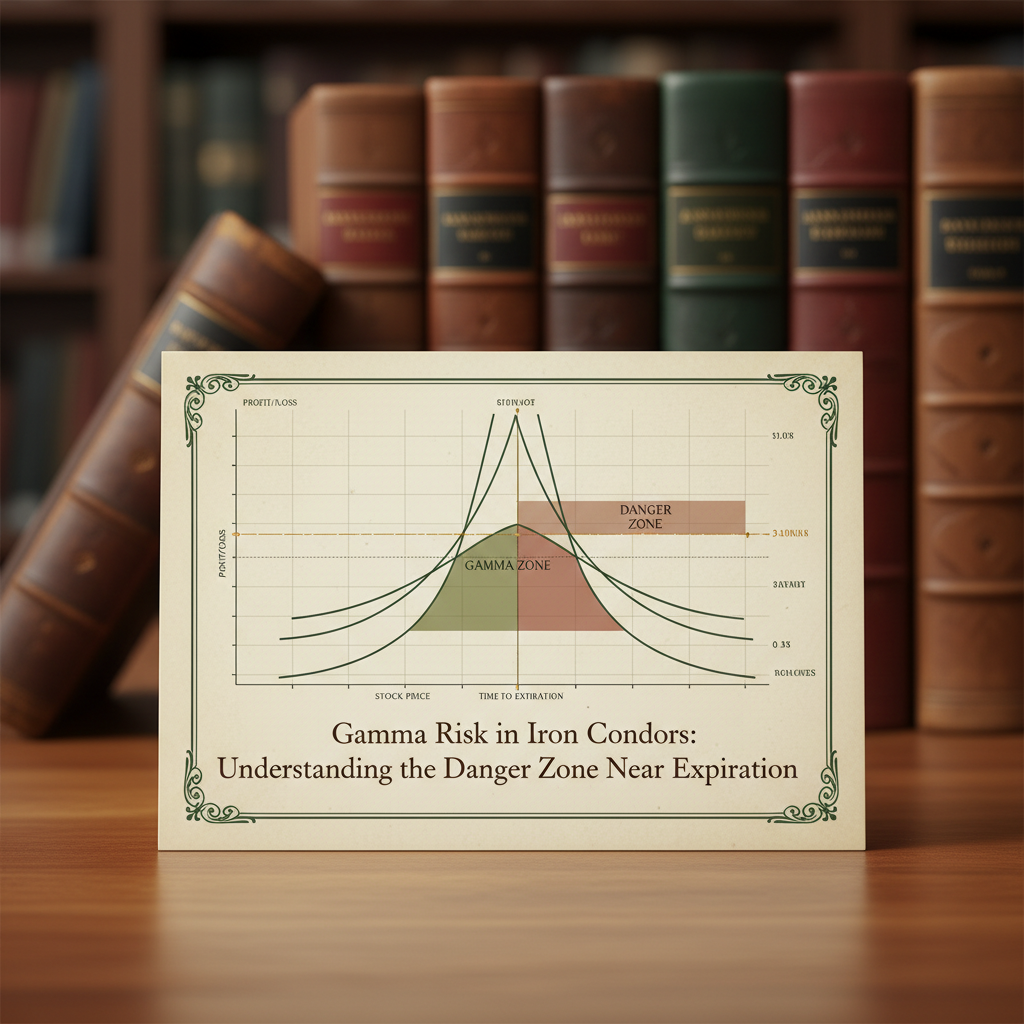
Gamma Risk in Iron Condors: Understanding the Danger Zone Near Expiration
Gamma Risk in Iron Condors: Understanding the Danger Zone Near Expiration As options traders, we often seek strategies that offer defined risk and a high probability of profit. The iron condor, a staple in many portfolios, perfectly embodies this philosophy. By selling out-of-the
Jan 1970
YOU MIGHT ALSO LIKE
Portfolio-Level Hedging for Iron Condor Traders: Using VIX Calls as Insurance
Portfolio-Level Hedging for Iron Condor Traders: Using VIX Calls as Insurance Portfolio-Level Hedging for Iron…
Read articleGamma Risk in Iron Condors: Understanding the Danger Zone Near Expiration
Gamma Risk in Iron Condors: Understanding the Danger Zone Near Expiration As options traders, we often seek st…
Read articleThe 50% Profit Target Rule: Why Closing Early Improves Your Long-Term Returns
The 50% Profit Target Rule: Why Closing Early Improves Your Long-Term Returns In the dynamic world of options…
Read articleThis article is for educational purposes only and does not constitute financial or investment advice. Options trading involves significant risk of loss and is not suitable for all investors. Past performance is not indicative of future results.