Reading the VIX Term Structure: Contango, Backwardation, and What They Mean for Your Trades
Reading the VIX Term Structure: Contango, Backwardation, and What They Mean for Your Trades Reading the VIX Term Structure: Contango, Backwardation, and What They Mean for Your Trades As options traders, we are acutely aware that volatility is the lifeblood of our strategies. It
Abstract
Reading the VIX Term Structure: Contango, Backwardation, and What They Mean for Your Trades Reading the VIX Term Structure: Contango, Backwardation, and What They Mean for Your Trades As options traders, we are acutely aware that volatility is the lifeblood of our strategies. It
Reading the VIX Term Structure: Contango, Backwardation, and What They Mean for Your Trades
As options traders, we are acutely aware that volatility is the lifeblood of our strategies. It dictates premium levels, influences option greeks, and often signals underlying market sentiment. Yet, many traders focus solely on the spot VIX level, missing a crucial, forward-looking indicator: the VIX term structure. This sophisticated tool, often visualized as the VIX futures curve, offers a nuanced perspective on future volatility expectations, providing invaluable insights into optimal entry timing for various options strategies, especially those involving short premium.
At Volatility Anomaly, we constantly emphasize the importance of understanding volatility beyond just a single number. The VIX term structure, with its distinct states of VIX contango and backwardation, is a powerful predictor of market behavior and a critical component of our analytical framework. In this deep dive, we will demystify the VIX futures curve, explain what its various shapes signify, and, most importantly, demonstrate how you can leverage this knowledge to enhance your trading decisions, particularly for short premium strategies.
Whether you're a seasoned professional or an aspiring options trader, mastering the VIX term structure will elevate your understanding of market dynamics and provide a significant edge. We'll explore specific scenarios, real-world examples, and actionable strategies to help you navigate the complex world of volatility with greater confidence and precision.
Background & Context: Why the VIX Term Structure Matters Now
In today's dynamic market environment, characterized by rapid shifts in sentiment and economic uncertainty, understanding implied volatility is more critical than ever. The VIX, often called the "fear gauge," provides a real-time measure of the market's expectation of 30-day forward volatility for the S&P 500. However, the spot VIX is just one piece of the puzzle. The VIX term structure, which plots the prices of VIX futures contracts across different expiration months, offers a much richer narrative.
Think of it this way: the spot VIX tells you what the market expects volatility to be over the next month, right now. The VIX futures curve tells you what the market expects volatility to be in two months, three months, six months, and so on. This forward-looking perspective is crucial because options contracts have varying expirations, and their pricing is influenced by the implied volatility for their respective time horizons. A deep understanding of the VIX futures curve allows traders to anticipate how volatility might evolve, rather than just reacting to its current state.
Historically, the market spends the vast majority of its time in a state of VIX contango, where longer-dated VIX futures trade at a premium to shorter-dated ones. This "normal" state reflects the inherent uncertainty of the future – the further out in time you go, the more potential events could impact the market, thus warranting a higher implied volatility. However, during periods of market stress or anticipated turbulence, the curve can invert, entering backwardation. Recognizing these shifts and their implications is paramount for strategy selection and risk management.
For short premium traders, the VIX term structure is particularly relevant. These strategies, such as selling credit spreads or iron condors, profit from the decay of implied volatility and time. Entering such trades when the term structure is favorable can significantly increase the probability of success, while entering at an unfavorable time can lead to unexpected losses. Our Volatility Anomaly system, with its focus on identifying optimal volatility environments, heavily incorporates VIX term structure analysis to inform our weekly picks and automated screener signals.
Core Concept Deep Dive: The VIX Futures Curve and Its Shapes
The VIX term structure is essentially a graphical representation of VIX futures prices across different expiration months. Each point on the curve represents the market's expectation of the VIX level at that specific future date. Understanding the shape of this curve is fundamental to interpreting market sentiment and making informed trading decisions.
What are VIX Futures?
VIX futures contracts allow traders to speculate on the future level of the VIX index. Unlike traditional futures contracts based on commodities or equities, VIX futures do not deliver a physical asset. Instead, they cash-settle against the VIX index at expiration. These contracts typically expire on the Wednesday preceding the third Friday of each month, and they are available for the next eight calendar months.
The price of a VIX future for a given month reflects the market's consensus estimate for what the VIX index will be on that future expiration date. By plotting these prices, we get the VIX futures curve.
Understanding Contango: The "Normal" State
VIX contango is the most common state of the VIX term structure. It occurs when longer-dated VIX futures contracts trade at progressively higher prices than shorter-dated contracts and the spot VIX. Visually, the curve slopes upwards from left to right.
- Characteristics:
- Spot VIX < Front-month VIX Future < Second-month VIX Future < ...
- Example: Spot VIX at 15.00, Front-month (e.g., May) VIX Future at 16.50, Second-month (e.g., June) VIX Future at 17.80.
- The difference between consecutive months is called the "roll yield" or "cost of carry" for VIX ETPs.
- Market Interpretation:
- Normal Market Conditions: Contango typically signals a calm or moderately bullish market environment. Traders expect current volatility to remain stable or decline slightly, but acknowledge that uncertainty naturally increases with time, hence the higher prices for longer-dated futures.
- Implied Volatility Decay: In contango, the front-month VIX future tends to converge downwards towards the spot VIX as expiration approaches (assuming the spot VIX doesn't spike). This downward pressure on short-term implied volatility is a key characteristic.
- Implications for Short Premium Strategies:
- Favorable Environment: Contango is generally the most favorable environment for selling premium. The downward bias in short-term implied volatility, coupled with the natural decay of time value, creates a tailwind for strategies like short vertical spreads, iron condors, and naked puts/calls.
- Example: If the VIX is in strong contango, say the VIX is 16.00, the May VIX future is 17.50, and the June VIX future is 18.80, selling a 30-day out-of-the-money (OTM) call spread on SPY, targeting a 0.15 delta, is more attractive. The market expects volatility to remain subdued, and the implied volatility for that 30-day period is likely to decay.
Understanding Backwardation: The "Fear" State
VIX backwardation is a less common but highly significant state of the VIX term structure. It occurs when shorter-dated VIX futures contracts trade at higher prices than longer-dated contracts and often higher than the spot VIX itself. Visually, the curve slopes downwards from left to right.
- Characteristics:
- Spot VIX < Front-month VIX Future > Second-month VIX Future > ... (Partial Backwardation)
- Spot VIX > Front-month VIX Future > Second-month VIX Future > ... (Full Backwardation)
- Example: Spot VIX at 28.00, Front-month (e.g., May) VIX Future at 27.00, Second-month (e.g., June) VIX Future at 25.50. Or, more acutely, Spot VIX at 35.00, May VIX Future at 32.00, June VIX Future at 29.00.
- Market Interpretation:
- Market Stress/Fear: Backwardation is a strong signal of immediate market fear or anticipated near-term turbulence. Traders are pricing in higher volatility for the very near future, expecting a significant event or correction.
- Flight to Safety: Often accompanies sharp market sell-offs.
- Implied Volatility Expansion: In backwardation, short-term implied volatility is elevated and expected to remain so, or even increase further, in the immediate future.
- Implications for Short Premium Strategies:
- Highly Unfavorable Environment: Backwardation is generally a dangerous environment for selling premium. The elevated short-term implied volatility means options are expensive, but the risk of further volatility spikes is high. The market is pricing in a high probability of a significant move, which can quickly turn short premium trades into losers.
- Example: If the VIX is in backwardation, say VIX at 28.00, May VIX future at 27.00, June VIX future at 25.50, selling a 30-day OTM call spread on SPY (e.g., 0.15 delta) is extremely risky. While the premium collected might be higher, the probability of the underlying asset moving significantly against you, coupled with potential further IV expansion, makes this a low-probability trade.
- Alternative Strategies: In backwardation, strategies that profit from rising volatility (e.g., long volatility, buying calls/puts, long straddles/strangles) or strategies that benefit from a market rebound (e.g., selling put spreads after a capitulation) might be more appropriate, but still require careful timing.
The VIX Term Structure and VIX ETPs
The VIX term structure is also critical for understanding the behavior of VIX-related Exchange Traded Products (ETPs) like VXX, UVXY, and SVXY. These products typically hold a basket of front-month and second-month VIX futures. In a contango environment, as the front-month future approaches expiration, it is "rolled" into the next month, which is trading at a higher price. This constant selling of lower-priced futures to buy higher-priced futures creates a persistent drag on the performance of long VIX ETPs (like VXX), known as "roll decay." Conversely, inverse VIX ETPs (like SVXY) benefit from this roll decay in contango. In backwardation, this dynamic reverses, and long VIX ETPs can see significant gains.
Practical Application: Timing Your Short Premium Trades
Understanding the VIX term structure isn't just academic; it's a powerful tool for optimizing your entry and exit points for short premium strategies. Our Volatility Anomaly system heavily integrates this analysis, as it directly impacts the probability of success for our weekly options picks.
Identifying Favorable Conditions: Strong VIX Contango
The ideal environment for selling premium is when the VIX term structure is in strong contango. This signals a market that expects current volatility to subside or remain stable, offering a favorable tailwind for options decay.
- What to Look For:
- Spot VIX: Generally below 20-25, indicating a relatively calm market.
- VIX Futures Curve: A clear upward slope. A good metric is the spread between the front-month and second-month VIX futures. A spread of 1.50 points or more (e.g., Front-month at 16.50, Second-month at 18.00) indicates decent contango.
- VIX Term Structure Slope: Calculate the percentage difference between the second-month and front-month VIX futures. A 10-15% difference or more is considered strong contango. For example, if the front-month is 16.00 and the second-month is 17.60, that's a 10% contango.
- IV Rank/Percentile: For the underlying asset (e.g., SPY, QQQ), the Implied Volatility Rank or Percentile should ideally be above 30-40%, indicating that options are somewhat "rich" relative to their historical volatility, but not excessively so.
Worked Example: Selling a Credit Spread in Contango
Let's consider a scenario on SPY (S&P 500 ETF) during a period of healthy VIX contango.
Date: October 26, 2023
Market Conditions:
- SPY Price: $420.00
- Spot VIX: 18.50
- VIX Futures Curve:
- NOV23 VIX Future: 19.80
- DEC23 VIX Future: 21.50
- JAN24 VIX Future: 22.80
- Interpretation: This is a clear contango environment. The NOV23 future is above the spot VIX, and subsequent months are progressively higher. The spread between NOV23 and DEC23 is 1.70 points (21.50 - 19.80), indicating a healthy upward slope. This suggests that the market expects current volatility to normalize or remain contained, making short premium strategies attractive.
- SPY IV Rank: 55% (indicating options are relatively expensive compared to SPY's historical IV range).
Entry Strategy: Selling an OTM Call Credit Spread on SPY
Given the contango and elevated IV Rank, selling a call credit spread on SPY makes sense. We want to target a delta that gives us a reasonable probability of profit, typically 0.10-0.25 delta for the short strike.
- Expiration: 30-45 days out. Let's choose the November 24, 2023 expiration (29 days to expiration).
- Short Strike: We look for a call strike with approximately a 0.15 delta. Let's say the SPY $435 Call has a 0.15 delta and is trading at $1.80.
- Long Strike: To define risk, we buy an OTM call further out. Let's choose the SPY $440 Call, trading at $1.00.
- Trade: Sell 1 SPY Nov 24 $435 Call @ $1.80, Buy 1 SPY Nov 24 $440 Call @ $1.00.
- Credit Received: $1.80 - $1.00 = $0.80 per share, or $80 per contract.
- Max Risk: Spread width - Credit received = $5.00 - $0.80 = $4.20 per share, or $420 per contract.
- Probability of Profit (POP): Approximately 85% (based on the short strike's delta and market pricing).
- Risk/Reward Ratio: $80 profit / $420 risk = 1:5.25 (a common ratio for high POP credit spreads).
Trade Management & Exit:
The VIX term structure remains in contango, and SPY trades sideways to slightly up, staying well below $435.
- Scenario 1 (Ideal): As expiration approaches (e.g., 7-10 days out), the SPY price is $425.00. The $435/$440 call spread has decayed significantly. You might be able to buy it back for $0.15-$0.20.
- Action: Close the spread for $0.15. Your profit is $0.80 - $0.15 = $0.65 per share, or $65 per contract (81% of max profit).
- Scenario 2 (Adjustment): SPY starts to rally and hits $430.00 with 15 days left. The $435 short call delta increases to 0.30, and the spread is trading at $0.40.
- Action: You might choose to roll the spread out in time and up in strike, or close it for a smaller profit/loss to preserve capital. For example, if the VIX term structure is still in strong contango, you could roll to the December expiration, selling a $440/$445 call spread for a new credit, further reducing your cost basis.
Identifying Unfavorable Conditions: VIX Backwardation
When the VIX term structure is in backwardation, it signals heightened fear and increased near-term volatility. This is a red flag for initiating new short premium trades.
- What to Look For:
- Spot VIX: Typically above 25-30, often much higher (40+ during extreme events).
- VIX Futures Curve: A downward slope. The front-month VIX future is lower than the spot VIX but higher than subsequent months. Or, in severe cases, the spot VIX is higher than all futures.
- VIX Term Structure Slope: The front-month VIX future is lower than the spot VIX, and the second-month is lower than the front-month. For example, Spot VIX at 30.00, Front-month at 28.50, Second-month at 27.00.
- IV Rank/Percentile: For the underlying asset, IV Rank will likely be very high (70%+) due to the market panic.
Why Avoid Short Premium in Backwardation:
- High Risk of Further Volatility Spikes: Backwardation implies the market expects volatility to remain high or increase further in the short term. This can lead to rapid price movements against your short strikes.
- Limited Premium Decay: While options premiums are high, the elevated implied volatility can counteract time decay, or even lead to IV expansion, causing your short options to gain value rather than lose it.
- Increased Gamma Risk: As options get closer to the money, gamma risk increases, meaning your delta changes rapidly with small moves in the underlying, making management difficult.
Instead of selling premium in backwardation, traders might consider:
- Long Volatility Strategies: Buying calls/puts, straddles, or strangles to profit from large moves.
- Waiting on the Sidelines: Often the best trade is no trade. Wait for the market to calm down and for contango to re-establish itself.
- Hedging: If you have existing long positions, backwardation is a good time to consider buying protective puts.
Our Volatility Anomaly system would flag such a backwardation environment as "High Risk for Short Premium" and would likely not generate new short premium picks until the term structure normalizes. This disciplined approach helps protect capital during turbulent times.
Risk Management: Navigating Volatility's Extremes
While understanding the VIX term structure provides a powerful edge, it does not eliminate risk. In fact, misinterpreting or ignoring its signals can lead to significant losses. Effective risk management is paramount, especially when dealing with volatility-driven strategies.
Risks of Trading in Contango:
- Sudden Shift to Backwardation: Even in strong contango, unexpected market events (e.g., geopolitical crisis, sudden economic data shock) can cause the VIX to spike rapidly and the term structure to flip into backwardation. This can quickly turn profitable short premium trades into losers.
- Underlying Asset Movement: While contango suggests a calmer market, the underlying asset can still move significantly against your short strikes. For example, a strong rally in SPY could blow through a short call spread, even if the overall VIX remains relatively low.
- Complacency: A prolonged period of strong contango can lead to complacency, causing traders to take on excessive risk or neglect proper position sizing.
Mitigating Risks in Contango:
- Position Sizing: Always adhere to strict position sizing rules. Risk no more than 1-2% of your capital on any single trade.
- Stop Losses: Implement clear stop-loss rules, either based on a percentage of max profit/loss or a breach of a technical level on the underlying. For credit spreads, a common stop is 2x the credit received (e.g., if you collect $0.80, close if the spread value reaches $1.60).
- Diversification: Don't put all your eggs in one basket. Diversify across different underlying assets and strategy types.
- Regular Monitoring: Continuously monitor the VIX term structure. If contango starts to flatten or show signs of backwardation, reassess your positions. Our Volatility Anomaly platform provides real-time monitoring of VIX term structure and IV metrics to help with this.
- Take Profits Early: Don't aim for 100% of max profit on credit spreads. Often, closing at 50-75% of max profit is a prudent strategy to lock in gains and reduce exposure.
Risks of Trading in Backwardation (or trying to "fade" it):
- Catching a Falling Knife: Trying to sell premium into backwardation (betting on a quick return to normalcy) is extremely risky. Volatility spikes can extend far beyond initial expectations, leading to rapid and substantial losses.
- Unlimited Loss Potential: For naked short options, backwardation significantly increases the probability of hitting the short strike, leading to potentially unlimited losses on short calls or substantial losses on short puts.
- Liquidity Issues: During extreme backwardation, market liquidity can dry up, making it difficult to adjust or exit positions at favorable prices.
Mitigating Risks in Backwardation:
- Avoid Short Premium: The simplest and often best advice is to avoid initiating new short premium trades during backwardation.
- Focus on Capital Preservation: Shift your focus from generating returns to preserving capital.
- Consider Long Volatility: If you must trade, consider strategies that profit from continued volatility, but be mindful of timing and potential for rapid reversals.
- Wait for Confirmation: If you believe backwardation is peaking, wait for clear signs of the term structure normalizing back into contango before re-entering short premium trades. Look for the spot VIX to decline significantly and the front-month future to start trading below the second-month again, with a healthy spread.
By integrating VIX term structure analysis into your risk management framework, you can proactively adjust your strategy to prevailing market conditions, significantly improving your long-term trading performance.
Advanced Considerations: Beyond Basic Contango and Backwardation
For experienced traders, the VIX term structure offers even more nuanced insights. Moving beyond the simple dichotomy of contango and backwardation can unlock deeper understanding and more sophisticated trading strategies.
The Steepness of Contango/Backwardation
It's not just about whether the curve is in contango or backwardation, but also how steep it is. A very steep contango (e.g., front-month VIX future 15.00, second-month 18.00, third-month 20.50) indicates a strong expectation of calm, implying significant roll decay for long VIX ETPs and a highly favorable environment for short premium strategies. Conversely, a very steep backwardation (e.g., front-month VIX future 35.00, second-month 30.00, third-month 26.00) signals extreme fear and high probability of continued turbulence.
- Actionable Insight: Steeper contango generally means higher probability of success for short premium, but also potentially less premium collected if IV is low. Steeper backwardation means higher risk for short premium, but also higher potential for long volatility strategies.
Changes in the Term Structure Slope
Monitoring the rate of change in the VIX term structure slope can be as important as the slope itself.
- Flattening Contango: If the contango curve starts to flatten (e.g., the spread between front and second month narrows from 2.00 points to 1.00 point), it could be an early warning sign of impending market stress, even if the market hasn't fully entered backwardation yet. This might be a signal to reduce exposure to short premium trades or tighten stop losses.
- Steepening Contango: If the contango curve is steepening, it reinforces the "all clear" signal for short premium and might indicate a good time to add to positions or initiate new ones.
- Easing Backwardation: When backwardation starts to ease (i.e., the curve becomes less steeply downward sloping, or even starts to flatten out), it can signal that the worst of the market panic is over. This might be an early signal to consider re-entering short premium trades, but with caution and smaller position sizes.
"Partial" vs. "Full" Backwardation
Sometimes, only the very front end of the curve is inverted. For example, the spot VIX might be 25.00, the front-month future 24.00, but the second-month future 24.50. This is a partial backwardation, suggesting near-term uncertainty but an expectation of quick resolution. Full backwardation, where all futures are below the spot VIX and progressively lower, indicates widespread and sustained fear.
- Actionable Insight: Partial backwardation might present opportunities for quick, tactical long volatility trades, but full backwardation typically warrants a more defensive stance or complete avoidance of short premium.
Term Structure and Specific Sector Volatility
While the VIX term structure is based on the S&P 500, similar term structures can be observed for other indices (e.g., VXN for Nasdaq 100) or even individual stocks with highly liquid options (e.g., AAPL, TSLA). Comparing the VIX term structure to the term structure of a specific underlying asset can provide insights into relative value.
- Example: If the VIX term structure is in strong contango, but the term structure for QQQ (Nasdaq 100 ETF) shows signs of flattening or even slight backwardation, it might indicate sector-specific weakness or anticipated volatility in tech stocks, making short premium trades on QQQ riskier than on SPY.
Using VIX Term Structure for Hedging
Advanced traders can use the VIX term structure to optimize hedging strategies. In contango, buying longer-dated VIX futures or VIX calls can be an expensive hedge due to roll decay. However, as the market approaches backwardation, the cost of hedging with VIX products can become more efficient, as the roll decay diminishes or even reverses.
- Actionable Insight: Consider initiating VIX hedges (e.g., buying VIX calls or VIX call spreads) when the VIX term structure shows signs of flattening contango or early backwardation, as this might be a more cost-effective entry point for protection against a volatility spike.
By incorporating these advanced considerations, traders can develop a more sophisticated understanding of volatility dynamics and fine-tune their strategies for various market conditions. At Volatility Anomaly, our automated screener and weekly picks often incorporate these deeper analyses to provide robust trade ideas.
Conclusion & Key Takeaways
The VIX term structure is far more than an academic curiosity; it is a dynamic, forward-looking indicator that provides profound insights into market sentiment and future volatility expectations. For options traders, especially those employing short premium strategies, understanding the difference between VIX contango and backwardation is not merely advantageous—it is essential for consistent profitability and robust risk management.
Contango, the "normal" state where longer-dated VIX futures are more expensive, signals a relatively calm market and is generally the most favorable environment for selling options premium. Here, the natural decay of time value and the tendency for implied volatility to revert lower provide a tailwind for strategies like credit spreads and iron condors. Conversely, backwardation, the "fear" state where shorter-dated futures are more expensive, warns of immediate market stress and heightened risk, making short premium strategies highly perilous.
By consistently monitoring the VIX futures curve, its slope, and its changes over time, traders can make more informed decisions about when to enter, manage, and exit their positions. This proactive approach, which is a cornerstone of the Volatility Anomaly methodology, allows you to align your strategies with the prevailing volatility regime, thereby increasing your probability of success and protecting your capital during turbulent times.
Key Takeaways for Traders:
- Master the VIX Term Structure: Always analyze the VIX futures curve, not just the spot VIX. It provides a forward-looking view of market volatility expectations.
- Embrace Contango for Short Premium: Strong VIX contango (upward sloping curve, front-month VIX future < second-month VIX future) is the most favorable environment for selling options premium. Look for a healthy spread (e.g., 1.50+ points) between the front two months.
- Avoid Backwardation for Short Premium: VIX backwardation (downward sloping curve, front-month VIX future > second-month VIX future, often spot VIX > front-month VIX future) signals market fear and is highly unfavorable for selling premium due to increased risk of volatility spikes.
- Monitor IV Rank/Percentile: Combine VIX term structure analysis with the IV Rank/Percentile of the underlying asset. Ideally, sell premium when the underlying's IV Rank is above 30-40% in a contango environment.
- Implement Robust Risk Management: Even in contango, use strict position sizing (1-2% capital risk per trade) and set clear stop-loss rules (e.g., 2x credit received for spreads). Be prepared to adjust or exit trades if the term structure shifts unexpectedly.
- Consider Advanced Nuances: Pay attention to the steepness of the curve and changes in its slope. A flattening contango or easing backwardation can provide early signals for strategic adjustments.
- Leverage Tools: Utilize platforms and screeners that provide real-time VIX term structure data and IV metrics, like those offered by Volatility Anomaly, to streamline your analysis and decision-making process.
#VolatilityAnomaly · #IVRank · #OptionsTrading · #VRP
You Might Also Like
Volatility Anomaly
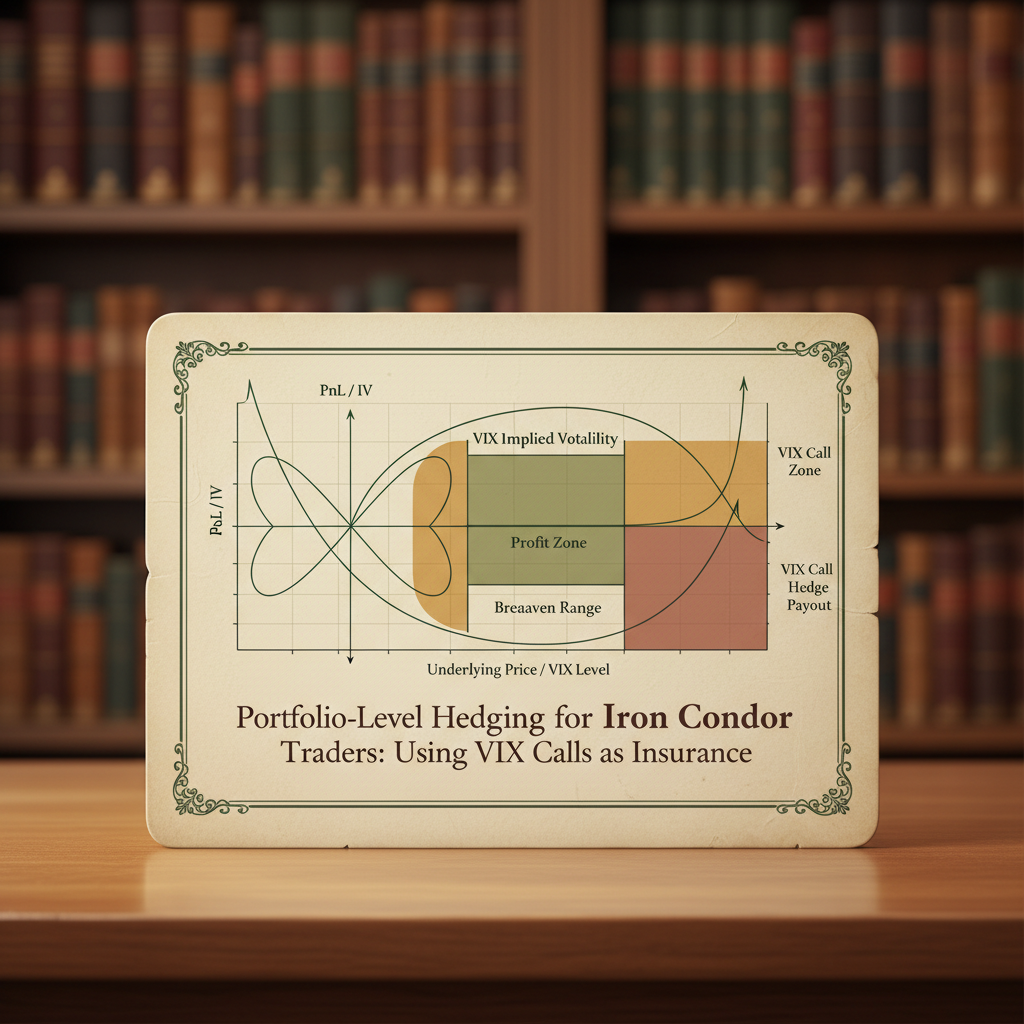
Portfolio-Level Hedging for Iron Condor Traders: Using VIX Calls as Insurance
Portfolio-Level Hedging for Iron Condor Traders: Using VIX Calls as Insurance Portfolio-Level Hedging for Iron Condor Traders: Using VIX Calls as Insurance In the world of options trading, strategies like the Iron Condor are highly popular for their ability to generate consistent
Jan 1970
Volatility Anomaly
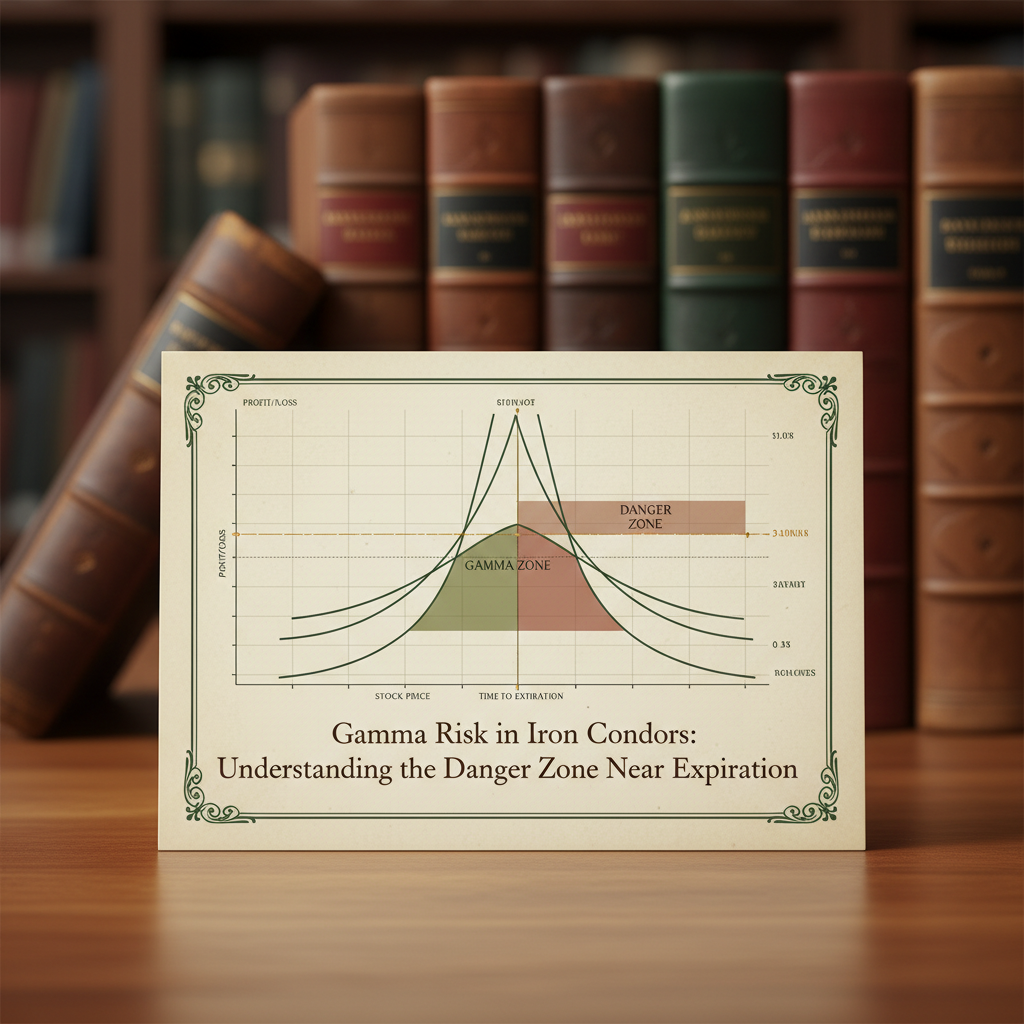
Gamma Risk in Iron Condors: Understanding the Danger Zone Near Expiration
Gamma Risk in Iron Condors: Understanding the Danger Zone Near Expiration As options traders, we often seek strategies that offer defined risk and a high probability of profit. The iron condor, a staple in many portfolios, perfectly embodies this philosophy. By selling out-of-the
Jan 1970
YOU MIGHT ALSO LIKE
Portfolio-Level Hedging for Iron Condor Traders: Using VIX Calls as Insurance
Portfolio-Level Hedging for Iron Condor Traders: Using VIX Calls as Insurance Portfolio-Level Hedging for Iron…
Read articleGamma Risk in Iron Condors: Understanding the Danger Zone Near Expiration
Gamma Risk in Iron Condors: Understanding the Danger Zone Near Expiration As options traders, we often seek st…
Read articleThe 50% Profit Target Rule: Why Closing Early Improves Your Long-Term Returns
The 50% Profit Target Rule: Why Closing Early Improves Your Long-Term Returns In the dynamic world of options…
Read articleThis article is for educational purposes only and does not constitute financial or investment advice. Options trading involves significant risk of loss and is not suitable for all investors. Past performance is not indicative of future results.