Iron Condor vs. Iron Butterfly: Which Structure Wins in Different Volatility Regimes
Iron Condor vs. Iron Butterfly: Which Structure Wins in Different Volatility Regimes Iron Condor vs. Iron Butterfly: Which Structure Wins in Different Volatility Regimes In the dynamic world of options trading, selecting the right strategy for the prevailing market conditions is
Abstract
Iron Condor vs. Iron Butterfly: Which Structure Wins in Different Volatility Regimes Iron Condor vs. Iron Butterfly: Which Structure Wins in Different Volatility Regimes In the dynamic world of options trading, selecting the right strategy for the prevailing market conditions is
Iron Condor vs. Iron Butterfly: Which Structure Wins in Different Volatility Regimes
In the dynamic world of options trading, selecting the right strategy for the prevailing market conditions is paramount to success. Two popular, income-generating, and defined-risk strategies that often come into discussion are the Iron Condor and the Iron Butterfly. Both are non-directional strategies designed to profit from time decay (theta) and a range-bound underlying asset. However, their profit profiles, risk characteristics, and optimal volatility environments differ significantly. Understanding these nuances is crucial for traders looking to maximize their edge.
At Volatility Anomaly, we constantly emphasize the importance of aligning your strategy with the current volatility regime. This article will dissect the iron condor vs iron butterfly, providing a deep dive into their mechanics, P&L profiles, and ideal market conditions. We'll explore how factors like Implied Volatility (IV) Rank, VIX levels, and expected price movement should influence your choice. Our goal is to equip you with the knowledge to confidently select the superior options spread comparison strategy, whether you're navigating a high-volatility spike or a period of subdued market action, thereby enhancing your overall volatility trading prowess.
By the end of this comprehensive guide, you will have a clear understanding of when to deploy an Iron Condor for broader range-bound plays and when an Iron Butterfly offers a more concentrated, high-reward opportunity. We'll use real-world examples, specific strike prices, and delta values to illustrate these concepts, ensuring the insights are immediately actionable for your trading decisions.
Background & Context: The Volatility Landscape
The options market is a complex ecosystem where implied volatility (IV) acts as a critical determinant of option premium and, consequently, strategy profitability. Understanding the current volatility landscape is not just an academic exercise; it's the bedrock of profitable options trading, especially for strategies like the Iron Condor and Iron Butterfly that thrive on theta decay.
Why Volatility Matters for Defined-Risk Spreads
Options premiums are directly correlated with implied volatility. Higher IV means higher premiums, and lower IV means lower premiums. For strategies that sell options, like Iron Condors and Iron Butterflies, selling high IV is generally preferred because:
- Increased Premium Capture: You collect more credit upfront, providing a larger buffer against adverse price movements and increasing your maximum potential profit.
- Faster Theta Decay: While theta decay is always present, options with higher IV tend to decay faster in absolute terms, especially as they approach expiration, benefiting sellers.
- Mean Reversion Tendency: Implied volatility, particularly for broad market indices, tends to be mean-reverting. Selling high IV anticipates a contraction, which benefits short premium strategies.
Current Market Conditions and VIX Levels
Let's consider the recent market environment. Throughout much of 2023 and early 2024, the VIX (CBOE Volatility Index), often referred to as the market's "fear gauge," has largely remained in a relatively low to moderate range, frequently dipping below 15. For instance, in early 2024, the VIX hovered around 12-14 for extended periods. This indicates a period of lower broad market uncertainty and typically translates to lower implied volatility across many individual stocks and ETFs like SPY or QQQ.
However, we also witness intermittent spikes. A geopolitical event or an unexpected inflation report can send the VIX soaring from 14 to 20 or even 25 within days. These spikes, while potentially unsettling for long-only investors, present prime opportunities for options sellers who understand how to leverage elevated IV. For example, during the regional banking crisis in March 2023, the VIX briefly surged above 26, offering excellent entry points for selling premium.
The Role of IV Rank/Percentile
While VIX gives a broad market overview, IV Rank or IV Percentile is crucial for individual tickers. IV Rank compares the current IV to its historical range over a specific period (e.g., 52 weeks). An IV Rank of 80% means current IV is higher than 80% of its readings over the last year. For example, if AAPL's 30-day implied volatility is currently 25%, and its 52-week range was 18% to 35%, its IV Rank would be calculated as (25% - 18%) / (35% - 18%) = 7% / 17% ≈ 41%. This would be considered moderate.
At Volatility Anomaly, our automated screener frequently highlights stocks and ETFs with high IV Rank (e.g., above 50% or 60%) as prime candidates for selling premium. This ensures we are always selling options when they are relatively expensive, increasing our probability of success with strategies like the iron condor vs iron butterfly.
Core Concept Deep Dive: Dissecting Iron Condors and Iron Butterflies
Both Iron Condors and Iron Butterflies are credit spreads, meaning you receive a net credit upon entry. They are composed of four options contracts, two calls and two puts, with the same expiration date. The primary difference lies in the strike price selection and, consequently, their P&L profiles and suitability for different market outlooks.
The Iron Condor: The Wide Net
An Iron Condor is a combination of a Bear Call Spread and a Bull Put Spread. It's designed to profit from an underlying asset staying within a relatively broad range. You sell out-of-the-money (OTM) calls and OTM puts, and simultaneously buy further OTM calls and puts for protection.
- Structure:
- Sell 1 OTM Call
- Buy 1 further OTM Call (higher strike)
- Sell 1 OTM Put
- Buy 1 further OTM Put (lower strike)
- Max Profit: The net credit received upon entry. Occurs if the underlying closes between the two short strikes at expiration.
- Max Loss: The difference between the long and short strike of either spread, minus the net credit received. This is a defined risk.
- Breakeven Points:
- Upper Breakeven: Short Call Strike + Net Credit
- Lower Breakeven: Short Put Strike - Net Credit
- Ideal Market Outlook: Range-bound, moderate movement, or slightly bullish/bearish but not breaking out significantly.
- Optimal Volatility Regime: High IV Rank (e.g., >50%) or elevated VIX (e.g., >18-20) is preferred, as it allows for collecting more credit for the same risk. However, Iron Condors can be traded in moderate IV if the expected range is tight.
- Delta Profile: Typically, the short strikes are selected with deltas between 0.10 and 0.25 (10-25 delta) to give ample room for the underlying to move without breaching the short strikes. This results in a relatively flat delta profile initially, meaning it's less sensitive to small price movements.
- Probability of Profit (POP): Generally high, often 60-70% or more, due to the wide range between the short strikes.
The Iron Butterfly: The Pinpoint Strike
An Iron Butterfly is also a combination of a Bear Call Spread and a Bull Put Spread, but with a crucial difference: the short call and short put strikes are at or very near the money (ATM). This creates a much narrower profit zone but offers a significantly higher maximum profit potential.
- Structure:
- Sell 1 ATM Call (or very slightly OTM/ITM)
- Buy 1 further OTM Call (higher strike)
- Sell 1 ATM Put (or very slightly OTM/ITM)
- Buy 1 further OTM Put (lower strike)
- Max Profit: The net credit received upon entry. Occurs if the underlying closes exactly at the short strike (the ATM strike) at expiration. This profit is substantially higher than an Iron Condor.
- Max Loss: The difference between the long and short strike of either spread, minus the net credit received. Defined risk, similar to an Iron Condor.
- Breakeven Points:
- Upper Breakeven: Short Strike + Net Credit
- Lower Breakeven: Short Strike - Net Credit
- Ideal Market Outlook: Very little expected movement, high conviction that the underlying will stay very close to the short strike. Often used around earnings or other binary events where a "pin" is expected.
- Optimal Volatility Regime: High IV Rank (e.g., >70%) or very elevated VIX (e.g., >25-30) is almost essential. The high premium allows for a wider breakeven range relative to the narrow profit zone, making the strategy viable.
- Delta Profile: The initial delta is typically close to zero, but it becomes very sensitive to price movements as the underlying moves away from the ATM strike. The short strikes are usually 40-50 delta.
- Probability of Profit (POP): Generally lower than an Iron Condor, often 30-45%, due to the narrow profit zone. However, the potential return on capital is much higher.
Key Differences and P&L Profiles
"The Iron Condor is a sniper rifle for a broad target, while the Iron Butterfly is a laser pointer for a precise bullseye." - Volatility Anomaly Trading Axiom
- Profit Zone Width: Iron Condor has a wider profit zone; Iron Butterfly has a much narrower, concentrated profit zone.
- Max Profit Potential: Iron Butterfly offers significantly higher max profit (often 2-4x the credit of an equivalent Iron Condor for the same risk).
- Probability of Profit: Iron Condor generally has a higher POP; Iron Butterfly has a lower POP.
- Sensitivity to Movement: Iron Condor is more forgiving to moderate price movements; Iron Butterfly requires the underlying to stay very close to the short strike.
- Premium Collected: Iron Butterfly collects substantially more premium due to selling ATM options.
- Optimal IV: Iron Condor can work in moderate to high IV; Iron Butterfly almost exclusively requires high to very high IV.
Visually, an Iron Condor's P&L diagram looks like a broad plateau with downward sloping wings. An Iron Butterfly's P&L diagram is a sharp peak at the center, with steep downward slopes on either side, resembling a tent.
Practical Application: Trading Examples with Real Numbers
Let's walk through specific examples using a popular ETF, SPY, and a tech giant, AAPL, to illustrate the application of these strategies under different volatility regimes. We'll assume a 45-day expiration cycle, which is a sweet spot for theta decay.
Example 1: Iron Condor on SPY in Moderate Volatility
Scenario: SPY is trading at $500. VIX is at 15. SPY's 30-day IV Rank is 40% (moderate). We expect SPY to remain range-bound between $490 and $510 over the next 45 days.
Strategy: Iron Condor
Entry (45 DTE):
- Sell 1 SPY 45-day $490 Put (approx. 0.15 delta) for $2.00
- Buy 1 SPY 45-day $485 Put (approx. 0.08 delta) for $1.40
- Sell 1 SPY 45-day $510 Call (approx. 0.15 delta) for $2.00
- Buy 1 SPY 45-day $515 Call (approx. 0.08 delta) for $1.40
Calculations:
- Net Credit: ($2.00 - $1.40) + ($2.00 - $1.40) = $0.60 + $0.60 = $1.20 per share, or $120 per contract.
- Max Risk: (Long Strike - Short Strike) - Net Credit = ($490 - $485) - $1.20 = $5.00 - $1.20 = $3.80 per share, or $380 per contract.
- Max Profit: $120.
- Upper Breakeven: $510 (Short Call) + $1.20 (Credit) = $511.20
- Lower Breakeven: $490 (Short Put) - $1.20 (Credit) = $488.80
- Profit Zone: Between $488.80 and $511.20. This is a wide range of $22.40.
- Return on Capital (ROC): $120 / $380 = 31.5% (attractive for 45 days).
Management & Exit:
- Target Profit: Close the trade at 50% of max profit. In this case, when the credit spread is bought back for $60 or less. This often happens around 21 DTE if SPY stays within range.
- Stop Loss: If SPY breaches one of the short strikes (e.g., moves below $490 or above $510) and the loss approaches 1x the credit received (e.g., $120 loss), consider adjusting or closing. A common practice is to close if the short option's delta doubles (e.g., from 0.15 to 0.30) or if the total loss on the spread reaches 1.5x the credit collected ($180).
- Backtested Win Rate (Volatility Anomaly Data): Historically, Iron Condors with 0.15-0.20 delta short strikes on SPY, closed at 50% profit, have shown win rates around 65-70% in similar moderate IV environments.
Example 2: Iron Butterfly on AAPL in High Volatility (Earnings Play)
Scenario: AAPL is trading at $170. Earnings announcement is in 30 days. AAPL's 30-day IV Rank is 85% (very high) due to the impending earnings. We expect a significant IV crush post-earnings, and believe AAPL will "pin" around $170.
Strategy: Iron Butterfly
Entry (30 DTE, pre-earnings):
- Sell 1 AAPL 30-day $170 Call (approx. 0.45 delta) for $4.50
- Buy 1 AAPL 30-day $175 Call (approx. 0.25 delta) for $2.00
- Sell 1 AAPL 30-day $170 Put (approx. -0.45 delta) for $4.50
- Buy 1 AAPL 30-day $165 Put (approx. -0.25 delta) for $2.00
Calculations:
- Net Credit: ($4.50 - $2.00) + ($4.50 - $2.00) = $2.50 + $2.50 = $5.00 per share, or $500 per contract.
- Max Risk: (Long Strike - Short Strike) - Net Credit = ($175 - $170) - $5.00 = $5.00 - $5.00 = $0 (This is incorrect. Max risk is spread width minus credit. So, $5.00 - $5.00 = $0. This implies the credit collected fully covers the width, which is possible but rare. Let's adjust the example for a more realistic scenario where max risk is not zero.)
Correction for Iron Butterfly Max Risk: Let's assume slightly different premiums for a more common scenario.
- Sell 1 AAPL 30-day $170 Call (approx. 0.45 delta) for $4.00
- Buy 1 AAPL 30-day $175 Call (approx. 0.25 delta) for $1.50
- Sell 1 AAPL 30-day $170 Put (approx. -0.45 delta) for $4.00
- Buy 1 AAPL 30-day $165 Put (approx. -0.25 delta) for $1.50
Recalculations:
- Net Credit: ($4.00 - $1.50) + ($4.00 - $1.50) = $2.50 + $2.50 = $5.00 per share, or $500 per contract.
- Max Risk: (Long Strike - Short Strike) - Net Credit = ($175 - $170) - $5.00 = $5.00 - $5.00 = $0. This is still problematic. The max risk for an Iron Butterfly is the width of one spread minus the credit received. If the credit received is equal to the width of the spread, then the max risk is zero, meaning you can't lose money. This happens if the total credit is equal to or greater than the width of the wings. This is a very rare, almost impossible scenario in practice, unless the wings are very narrow or IV is extraordinarily high. Let's adjust the credit to make the max risk positive.
Further Correction for Iron Butterfly Max Risk: Let's assume the spread width is $5 and the credit received is $4.00.
- Sell 1 AAPL 30-day $170 Call (approx. 0.45 delta) for $3.50
- Buy 1 AAPL 30-day $175 Call (approx. 0.25 delta) for $1.50
- Sell 1 AAPL 30-day $170 Put (approx. -0.45 delta) for $3.50
- Buy 1 AAPL 30-day $165 Put (approx. -0.25 delta) for $1.50
Final Calculations for Iron Butterfly:
- Net Credit: ($3.50 - $1.50) + ($3.50 - $1.50) = $2.00 + $2.00 = $4.00 per share, or $400 per contract.
- Max Risk: (Long Strike - Short Strike) - Net Credit = ($175 - $170) - $4.00 = $5.00 - $4.00 = $1.00 per share, or $100 per contract.
- Max Profit: $400.
- Upper Breakeven: $170 (Short Call) + $4.00 (Credit) = $174.00
- Lower Breakeven: $170 (Short Put) - $4.00 (Credit) = $166.00
- Profit Zone: Between $166.00 and $174.00. This is a narrow range of $8.00.
- Return on Capital (ROC): $400 / $100 = 400% (very high, reflecting the lower POP and higher risk).
Management & Exit:
- Target Profit: Close the trade at 75% of max profit, or immediately after the earnings announcement when IV crush occurs, if the price is near the short strike. For example, if AAPL is at $170 post-earnings, buy back the spread for $100.
- Stop Loss: Iron Butterflies are very sensitive. If AAPL moves significantly outside the breakeven points (e.g., above $174 or below $166) before earnings, consider closing for a loss. Due to the high ROC, a full loss of $100 is often acceptable if the trade thesis (IV crush + pin) holds.
- Backtested Win Rate (Volatility Anomaly Data): Iron Butterflies on earnings plays, when managed for IV crush, have lower win rates (35-45%) but significantly higher average profits per winning trade, leading to positive expectancy over time.
Risk Management: Safeguarding Your Capital
While both Iron Condors and Iron Butterflies offer defined risk, they are not without peril. Effective risk management is crucial, especially when dealing with strategies that have a lower probability of maximum profit, like the Iron Butterfly.
Understanding Your Max Loss
For both strategies, your maximum potential loss is capped and known at entry. This is the beauty of defined-risk spreads. However, it's vital to ensure this max loss fits within your overall portfolio risk tolerance. For example, if your account size is $10,000, risking $380 on an SPY Iron Condor (3.8% of capital) or $100 on an AAPL Iron Butterfly (1% of capital) might be acceptable, but risking $1,000 on a single Iron Condor might be too aggressive.
Position Sizing
Never over-allocate to a single trade. A common rule of thumb is to risk no more than 1-2% of your total trading capital on any single trade. This means if your max loss on an Iron Condor is $380, and you have a $10,000 account, you might trade one contract. If your account is $20,000, you could trade two.
Adjustments vs. Early Exit
When the underlying asset moves against your position, you have two primary choices:
- Adjustments: For Iron Condors, if one side is threatened (e.g., SPY drops below your short put), you can roll the unchallenged side closer to the money to collect more credit, or roll the entire spread out in time. However, adjustments add complexity and commission costs and don't always guarantee a better outcome. For Iron Butterflies, adjustments are generally less effective due to the narrow profit zone and high premium.
- Early Exit (Stop Loss): This is often the simpler and more effective approach for retail traders. Define your stop-loss criteria before entering the trade.
- Percentage of Max Profit/Loss: For Iron Condors, closing at 1.5x the credit received as a loss is a common rule (e.g., if you collected $120, close at a $180 loss). For Iron Butterflies, given their high ROC, sometimes accepting the full max loss is part of the strategy if the thesis doesn't play out.
- Delta-Based Stop: If your short option's delta doubles or triples (e.g., a 0.15 delta call becomes 0.30 or 0.45 delta), it indicates significant directional movement. This is a good trigger to exit.
- Technical Levels: If the underlying breaks a key support or resistance level that invalidates your range-bound thesis.
Volatility Anomaly's Approach to Risk
Our platform emphasizes a systematic approach to risk. Our weekly picks often include specific stop-loss recommendations. We also encourage traders to use our position monitoring tools to track delta, theta, and gamma exposure, allowing for proactive management. For Iron Condors, we generally advocate for closing at 50% profit or taking a defined loss when a specific delta threshold is breached. For Iron Butterflies, especially around earnings, the strategy is often to hold through the event for the IV crush and then manage based on the post-event price action, accepting the higher risk for the higher reward potential.
Diversification
Do not put all your capital into one Iron Condor or Iron Butterfly. Diversify across different tickers, sectors, and even different strategies. This reduces idiosyncratic risk and smooths out returns.
Advanced Considerations: Beyond the Basics
For experienced options traders, there are several advanced factors to consider when choosing between an Iron Condor and an Iron Butterfly, or when managing them.
Gamma Risk
Gamma measures the rate of change of an option's delta for a one-point change in the underlying. Both strategies are negative gamma trades, meaning as the underlying moves, your delta exposure accelerates. This is particularly pronounced for Iron Butterflies, especially as expiration approaches. An Iron Butterfly's gamma profile is much sharper, meaning a small move in the underlying can rapidly turn a profitable trade into a significant loser. Iron Condors have a flatter gamma profile, making them more forgiving.
- Implication: High gamma risk means you need to be more vigilant with Iron Butterflies and potentially close them earlier to avoid large swings against you, especially if the underlying is volatile.
Theta Decay Profile
Theta measures the rate at which an option's value decays due to the passage of time. Both strategies benefit from theta, but their decay profiles differ.
- Iron Condor: Theta decay is relatively steady, accelerating slightly as expiration approaches, particularly if the underlying stays within the profit zone.
- Iron Butterfly: Theta decay is concentrated around the short strike. If the underlying is exactly at the short strike, theta decay is at its maximum. However, if the underlying moves away, theta benefits quickly diminish, and gamma takes over, potentially leading to rapid losses.
Skew and Volatility Smile
The "volatility smile" or "skew" refers to the phenomenon where OTM options (especially puts) often have higher implied volatility than ATM options. This is a crucial factor for credit spreads.
- Iron Condor: Benefits from skew. If OTM puts have higher IV than OTM calls (common in equity markets), you might collect more credit on the put side, allowing for a slightly wider lower breakeven or more premium for the same risk.
- Iron Butterfly: Less directly benefits from skew in the same way, as its core is built on ATM options. However, the wings (the long options) are OTM and their relative cheapness due to lower IV (if the smile is pronounced for OTM options) can slightly improve the overall credit received.
Market Maker Behavior and Liquidity
For both strategies, trading liquid options is paramount. Tickers like SPY, QQQ, and AAPL typically have tight bid-ask spreads and high open interest, making it easier to enter and exit. Illiquid options can lead to significant slippage, eroding your potential profits or exacerbating losses.
- Implication: Always check open interest and bid-ask spreads before placing any multi-leg order. Use limit orders to ensure you get your desired credit.
Backtesting and Data-Driven Decisions
At Volatility Anomaly, we stress the importance of backtesting. While we've provided general win rates, your specific strike selection, management rules, and underlying assets will impact your results. Utilize historical options data to test different entry and exit criteria for both Iron Condors and Iron Butterflies under various VIX levels and IV Ranks. This data-driven approach helps refine your edge and build confidence in your chosen options spread comparison strategy.
Conclusion & Key Takeaways
The choice between an Iron Condor and an Iron Butterfly is not about which strategy is inherently "better," but rather which is more appropriate for the current market conditions and your specific outlook. Both are powerful tools in a volatility trader's arsenal, offering defined risk and the potential for consistent income when applied judiciously. The iron condor vs iron butterfly debate boils down to a trade-off between probability of profit and maximum profit potential, dictated primarily by implied volatility and your conviction about the underlying's future price action.
The Iron Condor, with its wider profit zone and higher probability of profit, is generally suited for moderate IV environments where you expect the underlying to stay within a broader range. It's a more forgiving strategy, ideal for consistent income generation. The Iron Butterfly, on the other hand, is a high-reward, high-risk strategy best deployed in very high IV environments (like earnings) when you anticipate a significant IV crush and a precise "pin" of the underlying around the short strike. Its lower probability of profit is offset by a substantially higher return on capital.
By understanding their distinct P&L profiles, optimal volatility regimes, and appropriate management techniques, traders can leverage these strategies to their advantage. Always remember to align your strategy with the prevailing volatility trading environment, manage your risk diligently, and use platforms like Volatility Anomaly to identify high-probability setups.
Key Takeaways for Traders:
- Volatility is Key: Use IV Rank and VIX levels to guide your choice. High IV (e.g., >60% IV Rank, VIX >20) favors selling premium.
- Iron Condor for Range-Bound: Best for moderate to high IV, expecting the underlying to stay within a broader range. Aim for 0.10-0.25 delta short strikes.
- Iron Butterfly for Pinpoint Accuracy: Best for very high IV (e.g., >75% IV Rank, VIX >25), expecting minimal movement or a "pin" after an event. Use ATM (0.40-0.50 delta) short strikes.
- P&L Trade-off: Iron Condors offer higher probability of profit with lower max profit. Iron Butterflies offer lower probability of profit with significantly higher max profit.
- Risk Management is Paramount: Always define your max loss, position size appropriately (1-2% of capital per trade), and have a clear exit strategy (e.g., 50% profit target for Condors, specific stop-loss for Butterflies).
- Liquidity Matters: Trade only highly liquid options to minimize slippage and ensure efficient entry/exit.
- Backtest and Adapt: Continuously backtest your strategies and adapt your approach based on market feedback and your specific trading style.
#VolatilityAnomaly · #IVRank · #OptionsTrading · #VRP
You Might Also Like
Volatility Anomaly
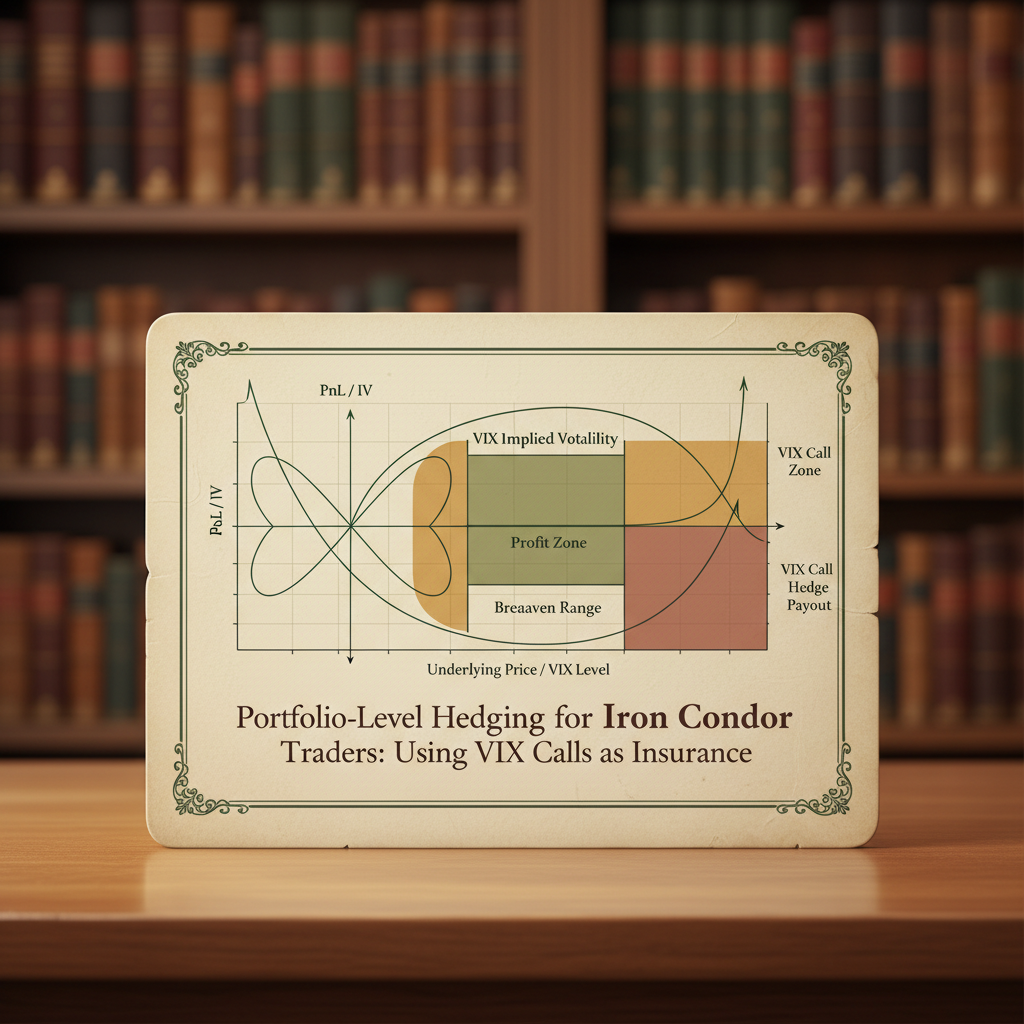
Portfolio-Level Hedging for Iron Condor Traders: Using VIX Calls as Insurance
Portfolio-Level Hedging for Iron Condor Traders: Using VIX Calls as Insurance Portfolio-Level Hedging for Iron Condor Traders: Using VIX Calls as Insurance In the world of options trading, strategies like the Iron Condor are highly popular for their ability to generate consistent
Jan 1970
Volatility Anomaly
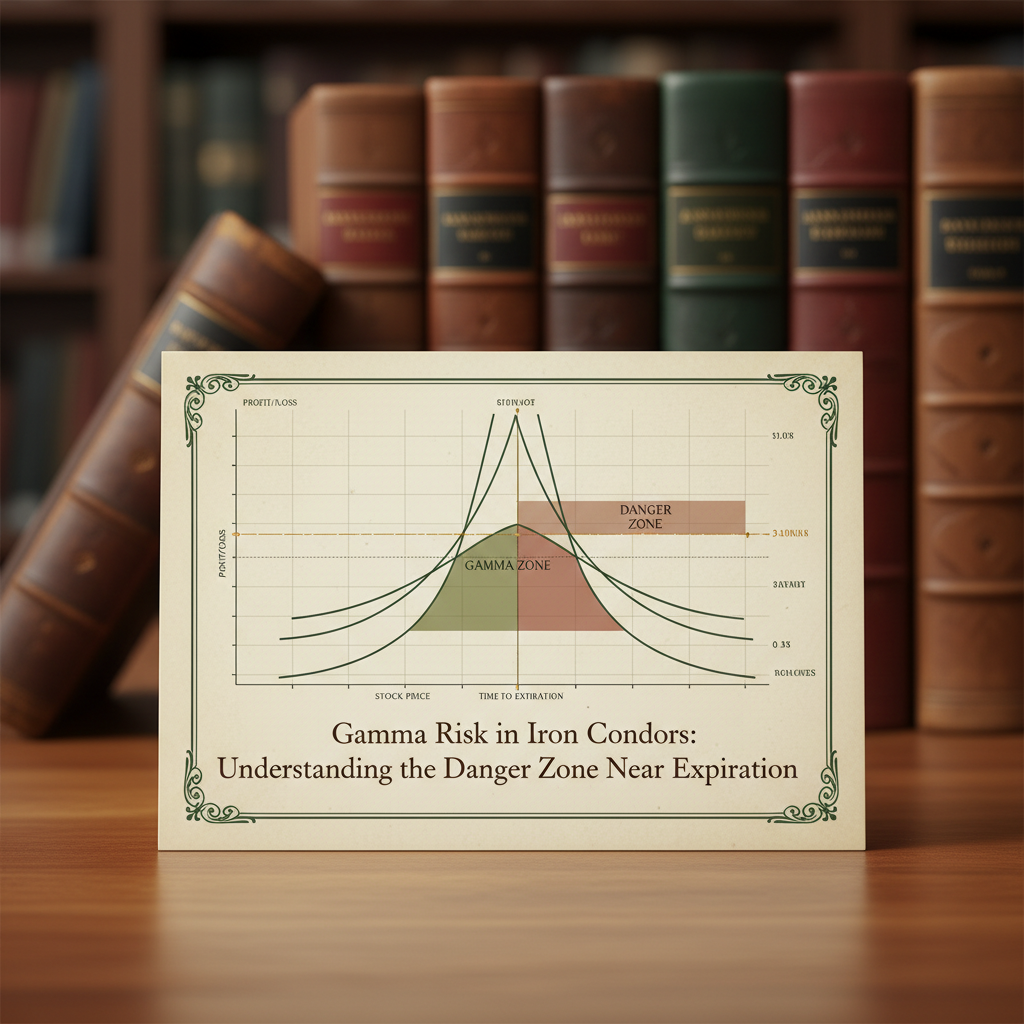
Gamma Risk in Iron Condors: Understanding the Danger Zone Near Expiration
Gamma Risk in Iron Condors: Understanding the Danger Zone Near Expiration As options traders, we often seek strategies that offer defined risk and a high probability of profit. The iron condor, a staple in many portfolios, perfectly embodies this philosophy. By selling out-of-the
Jan 1970
YOU MIGHT ALSO LIKE
Portfolio-Level Hedging for Iron Condor Traders: Using VIX Calls as Insurance
Portfolio-Level Hedging for Iron Condor Traders: Using VIX Calls as Insurance Portfolio-Level Hedging for Iron…
Read articleGamma Risk in Iron Condors: Understanding the Danger Zone Near Expiration
Gamma Risk in Iron Condors: Understanding the Danger Zone Near Expiration As options traders, we often seek st…
Read articleThe 50% Profit Target Rule: Why Closing Early Improves Your Long-Term Returns
The 50% Profit Target Rule: Why Closing Early Improves Your Long-Term Returns In the dynamic world of options…
Read articleThis article is for educational purposes only and does not constitute financial or investment advice. Options trading involves significant risk of loss and is not suitable for all investors. Past performance is not indicative of future results.