Using Technical Analysis to Time Iron Condor Entries: Support, Resistance, and Range
Using Technical Analysis to Time Iron Condor Entries: Support, Resistance, and Range Using Technical Analysis to Time Iron Condor Entries: Support, Resistance, and Range In the dynamic world of options trading, precision in entry timing can often be the difference between a profi
Abstract
Using Technical Analysis to Time Iron Condor Entries: Support, Resistance, and Range Using Technical Analysis to Time Iron Condor Entries: Support, Resistance, and Range In the dynamic world of options trading, precision in entry timing can often be the difference between a profi
Using Technical Analysis to Time Iron Condor Entries: Support, Resistance, and Range
In the dynamic world of options trading, precision in entry timing can often be the difference between a profitable trade and a losing one. While many options strategies, particularly those that are volatility-centric, often focus on implied volatility (IV) metrics, overlooking the power of technical analysis is a critical mistake. For strategies like the Iron Condor, which thrive in range-bound or sideways markets, identifying robust support and resistance levels is not just an advantage—it's a necessity.
At Volatility Anomaly, we advocate for a holistic approach to options trading, blending quantitative analysis with actionable technical insights. This article will delve deep into how astute traders can leverage technical analysis, specifically focusing on support, resistance, and market range identification, to significantly enhance their Iron Condor entry timing and strike selection. We'll explore how to define these critical levels, use them to set optimal strike prices, and ultimately improve the probability of success for your Iron Condor trades. Forget blindly selling premium; it's time to strategically place your bets where the market's structure provides the highest edge.
We'll provide concrete examples using popular tickers like SPY and QQQ, illustrating how to translate technical patterns into actionable options trades. Expect to see real numbers for strike prices, delta values, and IV percentiles, ensuring that the insights shared are immediately applicable to your trading strategy. By the end of this deep dive, you'll have a robust framework for integrating technical analysis into your Iron Condor playbook, moving beyond mere probability statistics to a more informed, tactical approach.
Why Technical Analysis Matters for Iron Condors Now: Market Conditions and Range-Bound Opportunities
The current market environment, characterized by periods of consolidation and often elevated uncertainty, makes the Iron Condor an increasingly attractive strategy. Following significant directional moves, markets frequently enter phases of digestion, where price action becomes choppy and confined within identifiable boundaries. This is precisely where the Iron Condor shines, allowing traders to profit from time decay (theta) while the underlying asset trades within a defined range.
Consider the market sentiment in early 2024. After a strong rally in late 2023, the S&P 500 (SPY) has shown signs of consolidation around all-time highs. While the overall trend may still be upward, the pace has slowed, and pullbacks are becoming more frequent, albeit often contained. This creates an ideal backdrop for Iron Condors, provided you can accurately pinpoint the likely trading range.
Implied Volatility (IV) also plays a crucial role. When IV is elevated (e.g., VIX above 18-20, or an IV Rank above 50%), the premium collected from selling options is higher, making Iron Condors more lucrative. However, elevated IV alone isn't enough; you need the market to stay within your chosen range. This is where technical analysis provides its indispensable value. It helps confirm whether the market is indeed setting up for a range-bound period, rather than preparing for a breakout or breakdown, which would be detrimental to an Iron Condor.
For instance, if SPY has an IV Rank of 65% and the VIX is at 19.50, the conditions for premium selling are favorable. But if SPY is simultaneously testing a multi-month trendline resistance for the fifth time, and momentum indicators are showing divergence, technical analysis suggests that a reversal or at least a pause (i.e., range-bound action) is more probable than a sustained breakout. Conversely, if SPY is consolidating just above a major support level after a sharp decline, and IV is high, an Iron Condor could capitalize on a potential bounce and subsequent range-bound trade.
Our Volatility Anomaly system often flags tickers with high IV Rank that are also exhibiting signs of consolidation or mean reversion. These are prime candidates for Iron Condors. However, the system provides the "what" (high IV, potential range), and technical analysis provides the "where" (specific support/resistance levels) and "when" (optimal entry timing relative to these levels). Marrying these two analytical approaches significantly elevates your edge, transforming a statistical probability play into a strategically informed trade.
Core Concept Deep Dive: Identifying Support, Resistance, and Defining the Range
The foundation of a successful Iron Condor entry using technical analysis lies in accurately identifying significant support and resistance levels. These are not arbitrary lines on a chart; they represent price levels where buying or selling pressure has historically been strong enough to reverse or halt price movement. For an Iron Condor, these levels become the natural boundaries for your short strike placements.
Understanding Support and Resistance
- Support: A price level where demand is strong enough to prevent the price from falling further. It acts as a floor. Think of it as a historical area where buyers stepped in.
- Resistance: A price level where supply is strong enough to prevent the price from rising further. It acts as a ceiling. This is where sellers historically dominated.
These levels are dynamic and can be identified using various technical tools:
1. Horizontal Price Levels (Swing Highs/Lows)
The most fundamental form of support and resistance comes from past price action. Look for areas where the price has repeatedly reversed or consolidated.
Example: If SPY has repeatedly bounced off $490 and failed to break above $510 over the past two months, these become strong horizontal support and resistance levels. A daily chart is often best for identifying these longer-term levels.
2. Moving Averages (MAs)
Dynamic support and resistance levels are often provided by moving averages. The 50-day, 100-day, and 200-day Simple or Exponential Moving Averages (SMA/EMA) are particularly popular.
Example: QQQ frequently finds support at its 50-day EMA during uptrends or resistance at its 200-day SMA during downtrends. A stock trading between its 50-day and 200-day MAs can be considered range-bound between these dynamic levels.
3. Fibonacci Retracement Levels
After a significant move, prices often retrace a portion of that move before continuing the trend. Fibonacci retracement levels (23.6%, 38.2%, 50%, 61.8%, 78.6%) often act as strong support or resistance.
Example: If AAPL rallies from $160 to $190, a 38.2% retracement would bring it down to approximately $178.50, which could then act as a support level.
4. Trendlines and Channels
Connecting a series of higher lows (for an uptrend) or lower highs (for a downtrend) creates trendlines. Parallel trendlines form channels, indicating a consistent slope of support and resistance.
Example: A stock trading within an ascending channel indicates it's range-bound within an upward-sloping corridor. An Iron Condor could be placed with short strikes outside this channel, anticipating continued movement within it.
5. Volume Profile / POC (Point of Control)
Volume Profile charts display the amount of volume traded at different price levels. High volume nodes (HVNs) indicate strong areas of support or resistance, while low volume nodes (LVNs) suggest weaker areas that price might move through quickly. The Point of Control (POC) is the price level with the highest traded volume.
Example: If SPY has a significant HVN at $500, this level is likely to act as strong support or resistance.
Defining the Range for Iron Condors
Once you've identified multiple potential support and resistance levels, your goal is to define a "trading range" that is likely to hold for the duration of your Iron Condor. This range should be robust enough to contain price action, but not so wide that the premium collected is negligible.
- Upper Boundary: The most significant resistance level you've identified. This will inform your short call strike.
- Lower Boundary: The most significant support level you've identified. This will inform your short put strike.
- Confirmation: Look for confluence. If a horizontal resistance level aligns with a 200-day MA and a Fibonacci retracement level, it's a much stronger resistance than a single indicator.
- Volatility Context: The width of your chosen range should also consider the underlying's historical volatility and current implied volatility. A stock with high IV will naturally have a wider expected range than one with low IV.
The ideal scenario for an Iron Condor is when the underlying asset is trading near the middle of this established range, giving both the call and put spreads sufficient room to breathe. Entering an Iron Condor when the price is already at an extreme (e.g., very close to resistance) increases the directional risk to one side.
Practical Application: Step-by-Step Example with SPY
Let's walk through a concrete example using the S&P 500 ETF (SPY) to illustrate how to apply these technical analysis principles for an Iron Condor entry. Our goal is to identify a range, select appropriate strikes, and manage the trade.
Scenario: SPY in Consolidation (Hypothetical Data, but Reflective of Market Behavior)
Date: March 15, 2024
Market Context: SPY has experienced a strong rally but has recently been consolidating. The VIX is at 16.80, and SPY's 30-day IV Rank is 55%, indicating moderately elevated implied volatility, favorable for premium selling.
Current SPY Price: $510.00
Step 1: Identify Key Support and Resistance Levels on SPY
We'll analyze the daily chart for SPY:
- Horizontal Resistance: We observe that SPY has repeatedly failed to break above $518 over the past month, with several candles topping out around this level. This suggests strong selling pressure.
- Horizontal Support: Looking back, SPY found strong support around $500-$502 a few weeks ago, bouncing off this area multiple times. This confluence of $500 (psychological) and $502 (prior swing low) forms a robust support zone.
- Moving Averages: The 50-day SMA is currently at $505.50, and the 20-day EMA is at $509.00. The 50-day SMA often acts as dynamic support.
- Fibonacci Retracement: If we draw a Fibonacci retracement from a recent low of $490 to a high of $518, the 38.2% retracement is at $507.25, and the 50% retracement is at $504.00.
Defining the Range:
Based on this analysis, we can establish a clear trading range:
- Upper Resistance Zone: $518 (strong horizontal resistance)
- Lower Support Zone: $500 (strong horizontal support, psychological level, near 50-day SMA, and 50% Fib retracement)
The current price of $510.00 is roughly in the middle of this $18 range ($500-$518), which is ideal for an Iron Condor.
Step 2: Select Expiration and Strike Prices
We want to select an expiration that allows sufficient time for the trade to play out (theta decay) but isn't so far out that premium is diluted by excessive time value. A 30-45 day expiration is often a sweet spot.
Let's choose the April 19, 2024 expiration (35 days to expiry).
Short Call Strike Selection: We want our short call strike to be comfortably above our identified resistance at $518. We'll aim for a delta between 0.10 and 0.20 for the short options.
- A $520 Call has a delta of approximately 0.18. This is just above our $518 resistance.
- A $522 Call has a delta of approximately 0.14. This provides a bit more buffer.
Let's choose the $522 Short Call for a slightly wider margin of safety.
Long Call Strike Selection: To define our call spread, we need a long call strike. A $2-$3 wide spread is common for SPY.
- A $524 Long Call would create a $2 wide spread.
- A $525 Long Call would create a $3 wide spread.
Let's choose the $524 Long Call for a $2 wide spread.
Short Put Strike Selection: We want our short put strike to be comfortably below our identified support at $500. Again, aiming for a delta between -0.10 and -0.20.
- A $498 Put has a delta of approximately -0.17. This is just below our $500 support.
- A $496 Put has a delta of approximately -0.13. This provides a bit more buffer.
Let's choose the $498 Short Put.
Long Put Strike Selection: To define our put spread, we need a long put strike, maintaining the same $2 width.
- A $496 Long Put would create a $2 wide spread.
Let's choose the $496 Long Put.
Step 3: Construct the Iron Condor and Calculate Premium
Our Iron Condor would be:
- Sell 1 SPY April 19, 2024 $522 Call (approx. $1.00 premium, delta 0.14)
- Buy 1 SPY April 19, 2024 $524 Call (approx. $0.60 premium)
- Sell 1 SPY April 19, 2024 $498 Put (approx. $0.95 premium, delta -0.17)
- Buy 1 SPY April 19, 2024 $496 Put (approx. $0.65 premium)
Net Credit Calculation:
Call Spread Credit: $1.00 - $0.60 = $0.40
Put Spread Credit: $0.95 - $0.65 = $0.30
Total Net Credit: $0.40 + $0.30 = $0.70 per share, or $70 per contract.
Max Risk: The width of the spread is $2.00. Max risk = Spread Width - Net Credit = $2.00 - $0.70 = $1.30 per share, or $130 per contract.
Probability of Profit (POP): Given the deltas, the theoretical POP for this trade would be approximately (1 - |delta of short call| - |delta of short put|) = (1 - 0.14 - 0.17) = 1 - 0.31 = 0.69 or 69%. This aligns with our technical analysis expectation that SPY will remain within the $500-$518 range.
Step 4: Trade Management and Exit Strategy
Profit Target: Aim to close the trade for 50-75% of max profit. If we collect $70, we'd look to buy it back for $17.50-$35.00. This typically occurs with 1-2 weeks left to expiration if the price stays within the range.
Stop Loss / Adjustment Trigger:
- If SPY breaks above $518 resistance and starts trading towards $520, the short call spread is threatened. Consider rolling the call spread up and out, or closing the entire Iron Condor to manage risk.
- If SPY breaks below $500 support and starts trading towards $498, the short put spread is threatened. Consider rolling the put spread down and out, or closing the entire Iron Condor.
- A common stop loss is 2x the credit received. If the value of the Iron Condor reaches $140 debit (initial credit $70 + $70 loss), close the trade.
Hypothetical Outcome:
Let's say by April 10, 2024 (9 days to expiry), SPY is trading at $508. The Iron Condor has decayed significantly. The $522/$524 call spread is worth $0.05, and the $498/$496 put spread is worth $0.10. The total value of the Iron Condor is $0.15.
We can buy back the Iron Condor for $0.15 ($15 per contract).
Profit = Initial Credit - Buy Back Debit = $70 - $15 = $55 per contract. This is approximately 78% of the max profit, a successful trade.
Risk Management: What Can Go Wrong and How to Protect Yourself
While technical analysis provides a powerful edge for Iron Condor entry, no strategy is foolproof. Markets are dynamic, and even the strongest support or resistance levels can break. Effective risk management is paramount to long-term success.
1. The Breakout/Breakdown Risk
The primary risk for an Iron Condor is a strong directional move that breaches either your short call or short put strike. Despite identifying robust support and resistance, a fundamental shift, unexpected news, or a surge in momentum can invalidate these levels.
Mitigation:
- Position Sizing: Never allocate more than 1-2% of your total trading capital to any single Iron Condor trade. This ensures that a single losing trade doesn't significantly impair your account.
- Stop Loss Orders: While not always ideal for spreads due to slippage, having a mental or actual stop loss is crucial. A common rule is to close the entire Iron Condor if the debit to close reaches 2x the initial credit received. For our SPY example, if the initial credit was $70, you'd close if the condor's value reached a $140 debit.
- Active Monitoring: Don't set and forget. Monitor the underlying's price action, especially around your identified support and resistance levels.
2. Volatility Crush (Too Early Exit) vs. Volatility Spike (Increased Risk)
Iron Condors benefit from high implied volatility at entry and a subsequent drop in IV (volatility crush). However, IV can spike unexpectedly, increasing the value of your short options and potentially pushing the price towards your strikes.
Mitigation:
- IV Rank Consideration: Enter when IV Rank is high (above 50-60%). This increases the likelihood of an IV crush benefiting your trade. Our Volatility Anomaly screener highlights these opportunities.
- VIX Monitoring: Keep an eye on the VIX. A sudden spike in VIX often precedes a sharp market move, which could threaten your Iron Condor.
- Time Horizon: Avoid holding Iron Condors through major economic announcements (e.g., FOMC meetings, CPI reports, earnings) for the underlying or the broader market (for SPY/QQQ) unless you are comfortable with the increased risk.
3. Early Assignment Risk (for American-style options)
While rare for out-of-the-money options, early assignment is a theoretical risk, especially for puts if the underlying pays a dividend and the put is deep in the money.
Mitigation:
- European-style options: Trade on indices like SPX or NDX, which are cash-settled and not subject to early assignment.
- Avoid dividend ex-dates: Be aware of dividend ex-dates for equity options, particularly for short puts.
4. Gamma Risk and Pin Risk Near Expiration
As expiration approaches, gamma risk increases dramatically. Small price movements can lead to large delta changes, making the trade highly sensitive to price. Pin risk occurs when the underlying closes exactly at one of your short strikes, leading to potential assignment on both sides of a spread.
Mitigation:
- Close Early: A common practice is to close Iron Condors with 7-10 days remaining until expiration, especially if you've achieved 50-75% of max profit. This avoids the unpredictable gamma risk and pin risk of the final week.
- Roll Adjustments: If a strike is threatened, consider rolling the challenged side (e.g., roll the call spread up and out in time) to give the trade more room and time.
5. Slippage and Commission Costs
Entering and exiting multi-leg strategies like Iron Condors can incur higher commission costs and potential slippage, especially in less liquid options.
Mitigation:
- Liquid Underlyings: Stick to highly liquid ETFs (SPY, QQQ) or large-cap stocks (AAPL, MSFT) with tight bid-ask spreads.
- Limit Orders: Always use limit orders for entry and exit to control your fill price. Be patient.
By proactively addressing these risks, traders can build a more resilient Iron Condor strategy, leveraging technical analysis for entry timing while safeguarding against adverse market movements.
Advanced Considerations for Experienced Traders
For those who have mastered the basics of Iron Condors and technical analysis, several advanced techniques can further refine entry timing and strike selection.
1. Confluence of Indicators and Multiple Timeframes
Stronger support and resistance levels are often found where multiple technical indicators converge.
Example: If a horizontal resistance level on the daily chart aligns with the 200-day SMA, a Fibonacci 61.8% retracement, and the upper Bollinger Band, that's a much more significant resistance zone.
Actionable Insight: Before placing an Iron Condor, confirm your identified range on multiple timeframes. A strong resistance on the daily chart might be confirmed by a similar level on the weekly chart, adding conviction. Conversely, if a daily resistance is easily pierced on a 4-hour chart, it might be weaker than initially perceived.
2. Incorporating Market Internals and Breadth
For index-based Iron Condors (SPY, QQQ), understanding the underlying market's health can provide crucial context.
Example: If SPY is at a technical resistance, but market breadth (e.g., % of stocks above their 200-day MA) is strong, and new highs are expanding, the resistance might be weaker than it appears, signaling a potential breakout. Conversely, if breadth is deteriorating while SPY is at resistance, it adds conviction to a potential reversal or consolidation.
Actionable Insight: Use indicators like the McClellan Oscillator, Advance/Decline Line, or the percentage of stocks above key moving averages (e.g., % of NASDAQ stocks above 50-day MA) to gauge the strength of a potential range-bound environment. A market with weakening internals but holding key levels is often ripe for consolidation.
3. Dynamic Adjustments and Rolling Strategies
Even with perfect entry timing, markets can be unpredictable. Experienced traders don't just set and forget; they actively manage.
Example: If SPY starts to challenge your short call strike (e.g., price moves from $510 to $516, threatening your $522 short call), you might consider rolling the entire call spread up and out in time. For instance, close the $522/$524 call spread and open a new $525/$527 call spread in the next monthly expiration. This collects additional credit, gives the trade more time, and moves your resistance further away.
Actionable Insight: Learn to "roll with the punches." If one side of your condor is threatened, consider rolling that side (e.g., roll the call spread up and out) or rolling the entire condor (close and reopen a new one with adjusted strikes and/or expiration) to defend the trade and potentially collect more premium. The Volatility Anomaly platform's position monitoring tools can help identify when a strike is being challenged.
4. Skew and Volatility Smile Considerations
The implied volatility for out-of-the-money options is not uniform. OTM puts often have higher IV than OTM calls (put skew), especially in bearish markets.
Example: If SPY's IV for OTM puts is significantly higher than OTM calls, you might collect more premium on the put side of your Iron Condor, even with similar delta values.
Actionable Insight: Analyze the volatility smile/skew for your chosen underlying. If there's a significant skew, you might strategically place your short put strike further from the money (lower delta) than your short call strike (higher delta) to balance the premium collected or vice-versa, depending on your directional bias within the range.
5. Iron Condors with a Slight Directional Bias
While Iron Condors are typically neutral, technical analysis can sometimes suggest a slight bias within a range.
Example: If SPY is consolidating but showing higher lows within its range, you might place your short put strike closer to the money (higher delta) than your short call strike (lower delta), effectively creating a slightly bullish Iron Condor that profits more if SPY stays in the upper part of its range.
Actionable Insight: Use momentum indicators (RSI, MACD) or candlestick patterns to identify subtle directional biases within the defined range. Adjust your short strike deltas accordingly to reflect this bias, while still keeping both short strikes outside strong support/resistance.
Conclusion & Key Takeaways
The art of trading Iron Condors is significantly elevated when combined with the science of technical analysis. Moving beyond mere probability statistics, integrating robust support and resistance identification transforms the Iron Condor from a blind premium-selling strategy into a highly tactical and informed approach. By precisely defining market ranges, traders can place their short strikes with greater confidence, capitalizing on the market's natural tendency to consolidate and revert to the mean after directional moves.
At Volatility Anomaly, our mission is to empower traders with comprehensive tools and education. While our automated screeners excel at identifying high IV opportunities, it is the astute application of technical analysis that provides the critical "where" and "when" for optimal Iron Condor entries. This synergistic approach allows you to not only find the best statistical setups but also to confirm them with the underlying market's structural integrity.
Remember, no technical level is infallible, and market conditions can shift rapidly. Therefore, combining intelligent entry timing with disciplined risk management—including appropriate position sizing, stop-loss strategies, and active monitoring—is paramount. By mastering these techniques, you'll be well-equipped to navigate range-bound markets with greater precision and profitability.
Key Takeaways for Timing Iron Condor Entries:
- Define Your Range with Precision: Use horizontal price levels (swing highs/lows), moving averages, Fibonacci retracements, and trendlines to identify strong, confluent support and resistance zones.
- Optimal Entry is Mid-Range: Aim to enter an Iron Condor when the underlying asset is trading near the middle of its established technical range, providing buffer to both short strikes.
- Strike Selection Aligned with Technicals: Place your short call strike comfortably above resistance and your short put strike comfortably below support. Target 0.10-0.20 deltas for these short strikes.
- Confirm with Volatility: Ensure the underlying has a favorable IV Rank (e.g., >50%) and VIX levels are supportive of premium selling, as identified by Volatility Anomaly's tools.
- Active Risk Management is Non-Negotiable: Implement strict position sizing, use stop-loss triggers (e.g., 2x credit received), and consider closing trades early (7-10 DTE) to mitigate gamma and pin risk.
- Monitor and Adjust: Continuously monitor the underlying's price action relative to your support/resistance and be prepared to roll or adjust the Iron Condor if a strike is threatened.
- Advanced Confluence: For experienced traders, leverage multiple timeframes, market internals, and volatility skew to further refine your entry and strike placement.
#VolatilityAnomaly · #IVRank · #OptionsTrading · #VRP
You Might Also Like
Volatility Anomaly
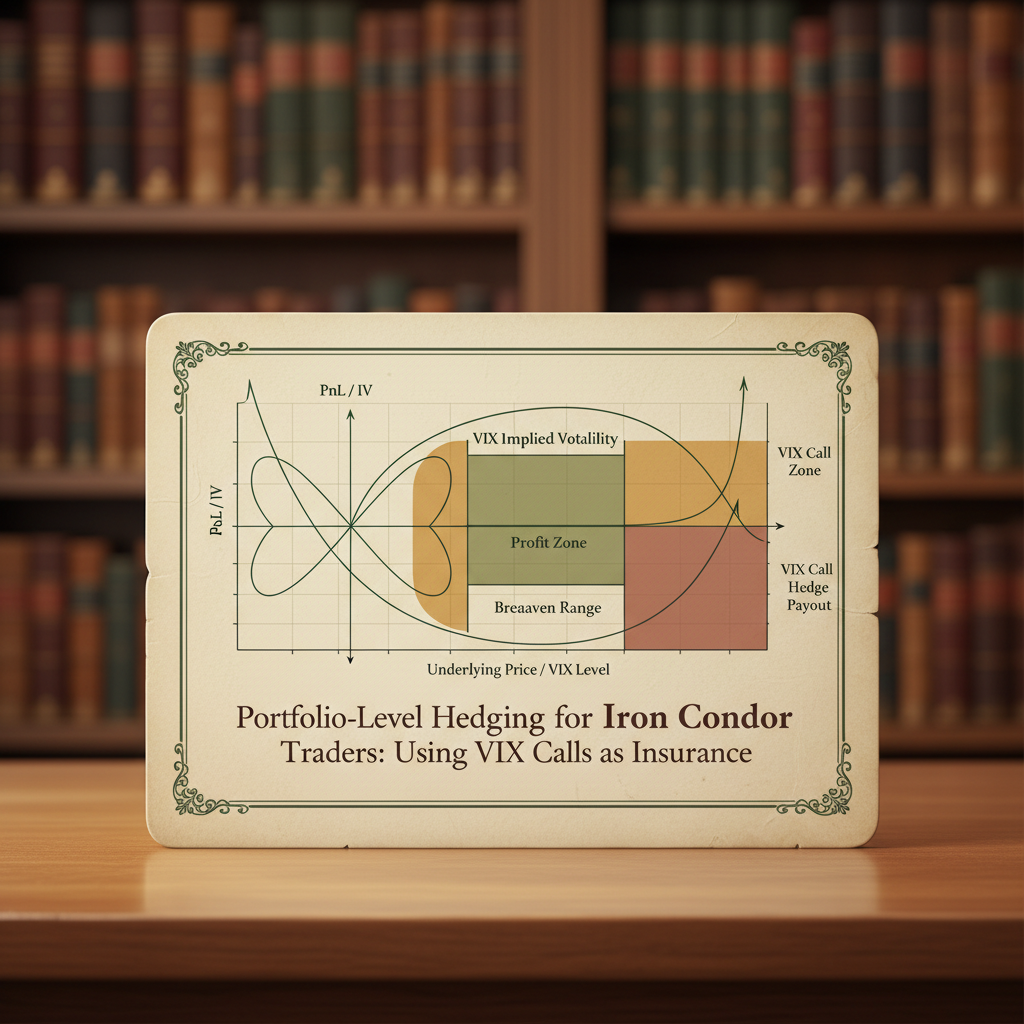
Portfolio-Level Hedging for Iron Condor Traders: Using VIX Calls as Insurance
Portfolio-Level Hedging for Iron Condor Traders: Using VIX Calls as Insurance Portfolio-Level Hedging for Iron Condor Traders: Using VIX Calls as Insurance In the world of options trading, strategies like the Iron Condor are highly popular for their ability to generate consistent
Jan 1970
Volatility Anomaly
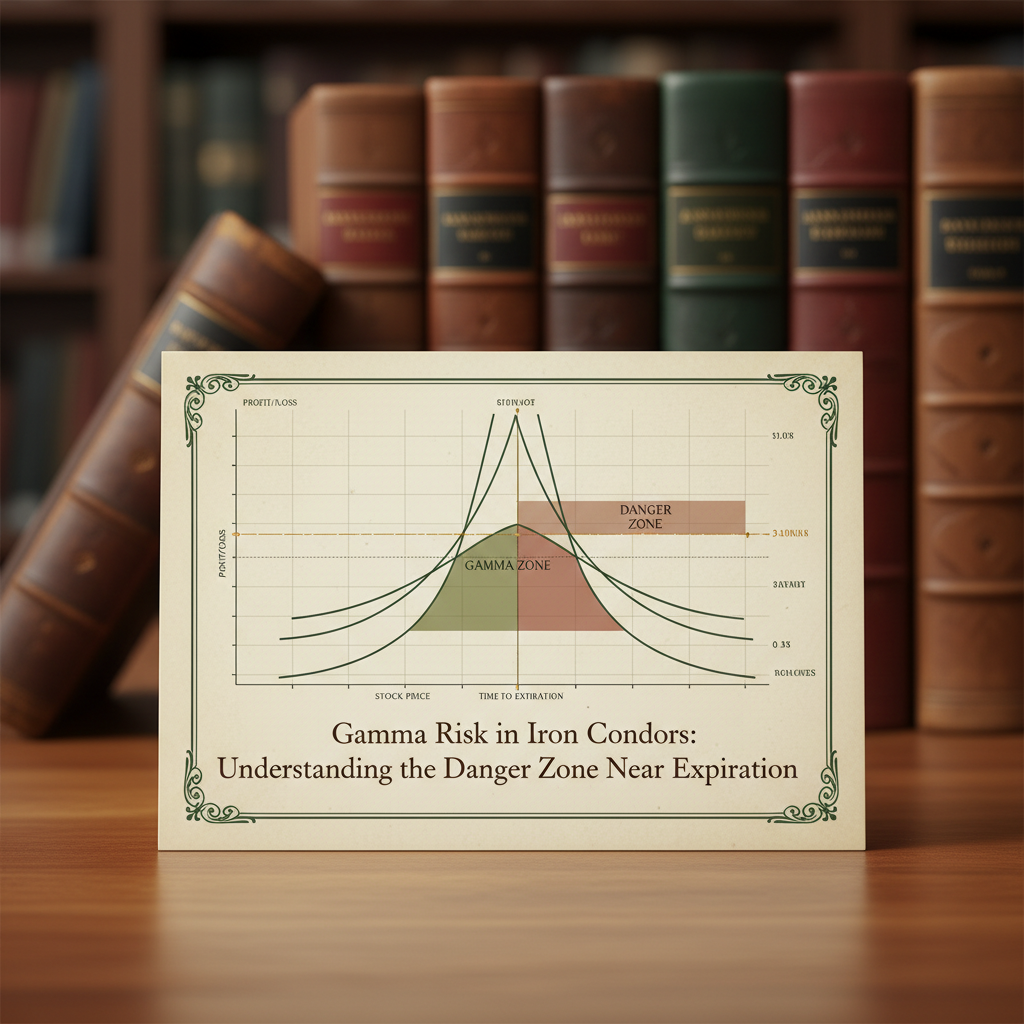
Gamma Risk in Iron Condors: Understanding the Danger Zone Near Expiration
Gamma Risk in Iron Condors: Understanding the Danger Zone Near Expiration As options traders, we often seek strategies that offer defined risk and a high probability of profit. The iron condor, a staple in many portfolios, perfectly embodies this philosophy. By selling out-of-the
Jan 1970
YOU MIGHT ALSO LIKE
Portfolio-Level Hedging for Iron Condor Traders: Using VIX Calls as Insurance
Portfolio-Level Hedging for Iron Condor Traders: Using VIX Calls as Insurance Portfolio-Level Hedging for Iron…
Read articleGamma Risk in Iron Condors: Understanding the Danger Zone Near Expiration
Gamma Risk in Iron Condors: Understanding the Danger Zone Near Expiration As options traders, we often seek st…
Read articleThe 50% Profit Target Rule: Why Closing Early Improves Your Long-Term Returns
The 50% Profit Target Rule: Why Closing Early Improves Your Long-Term Returns In the dynamic world of options…
Read articleThis article is for educational purposes only and does not constitute financial or investment advice. Options trading involves significant risk of loss and is not suitable for all investors. Past performance is not indicative of future results.